> ## Documentation Index
> Fetch the complete documentation index at: https://docs.apinizer.com/llms.txt
> Use this file to discover all available pages before exploring further.
# API Proxy Creation Report
> You can visualize time-based creation statistics of API Proxies created in Apinizer. You can view monthly creation metrics in graph and list views according to determined filter fields and analyze API Proxy creation trends.
 ## View Options
This report offers two different views:
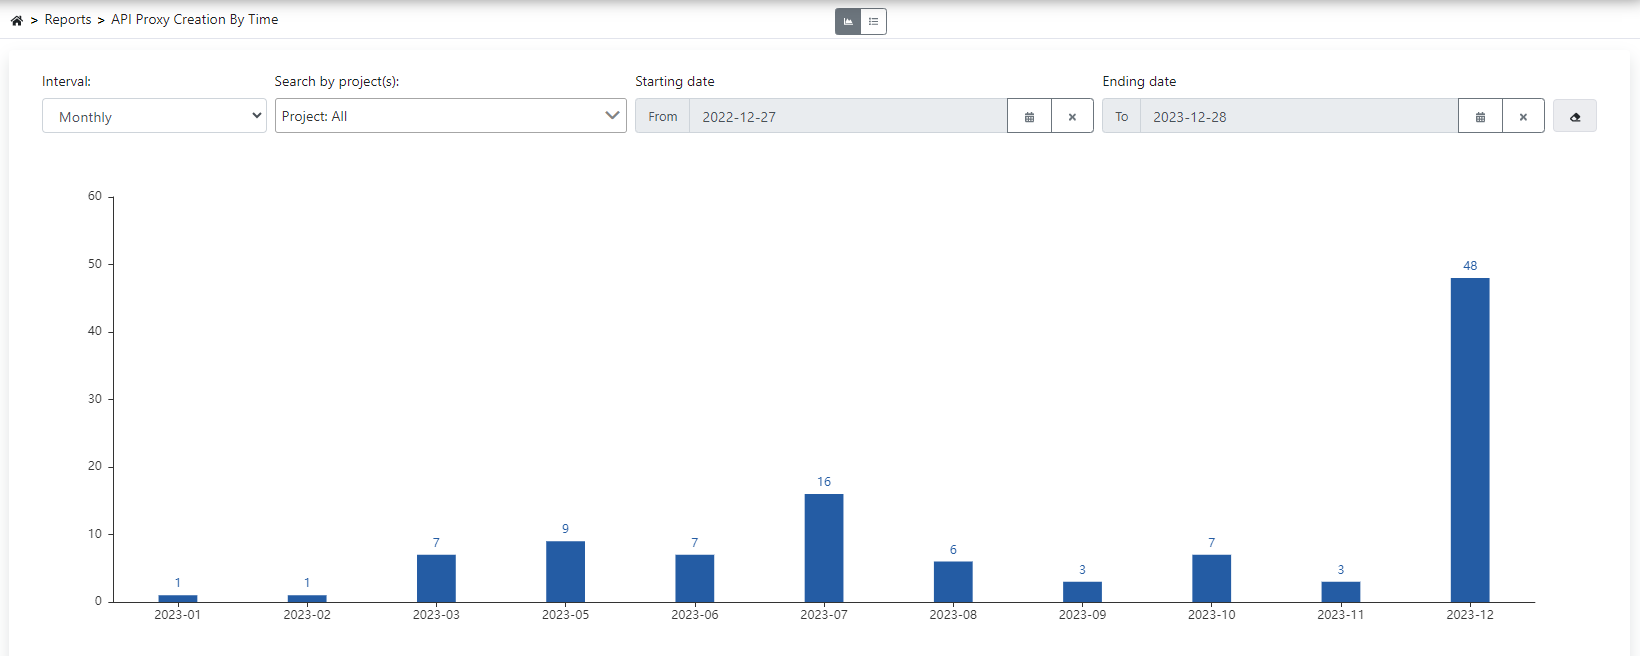
Shows graphically how many API Proxies were created monthly in the date range determined from filters.
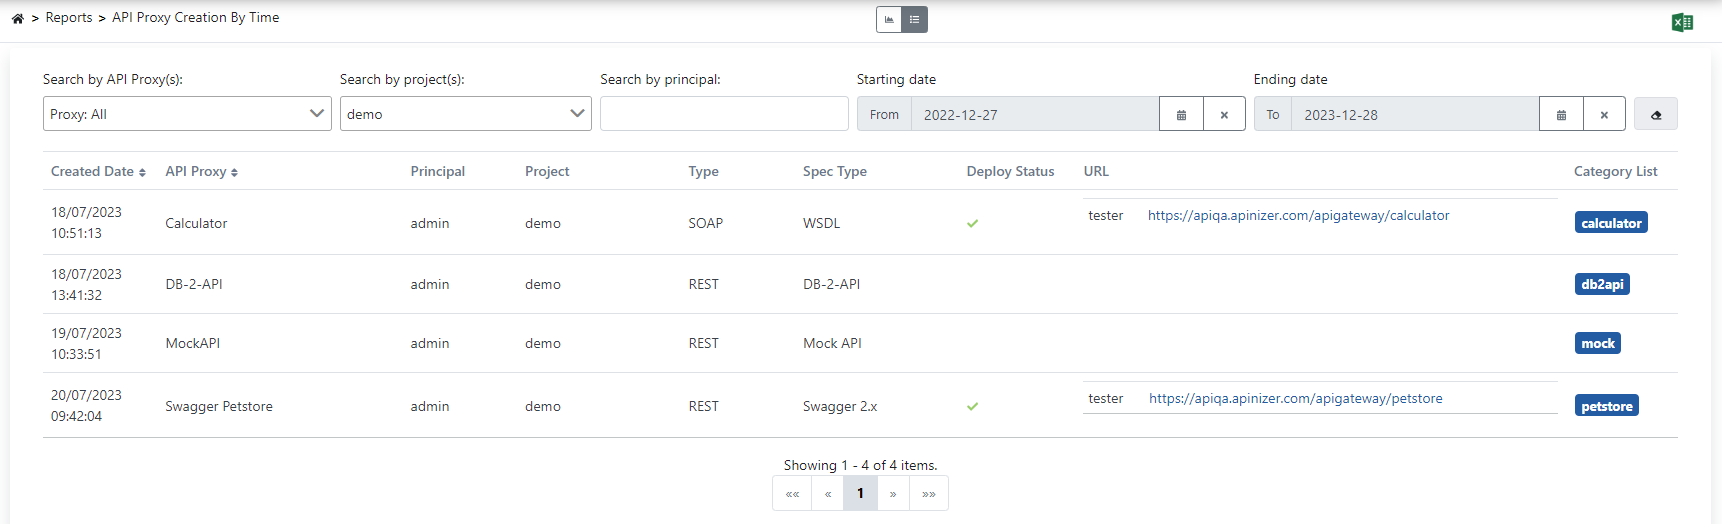
Lists data in the graph view in detail in table format.
## View Options
This report offers two different views:
Shows graphically how many API Proxies were created monthly in the date range determined from filters.
Lists data in the graph view in detail in table format.