> ## Documentation Index
> Fetch the complete documentation index at: https://docs.apinizer.com/llms.txt
> Use this file to discover all available pages before exploring further.
# API Traffic (Over Time)
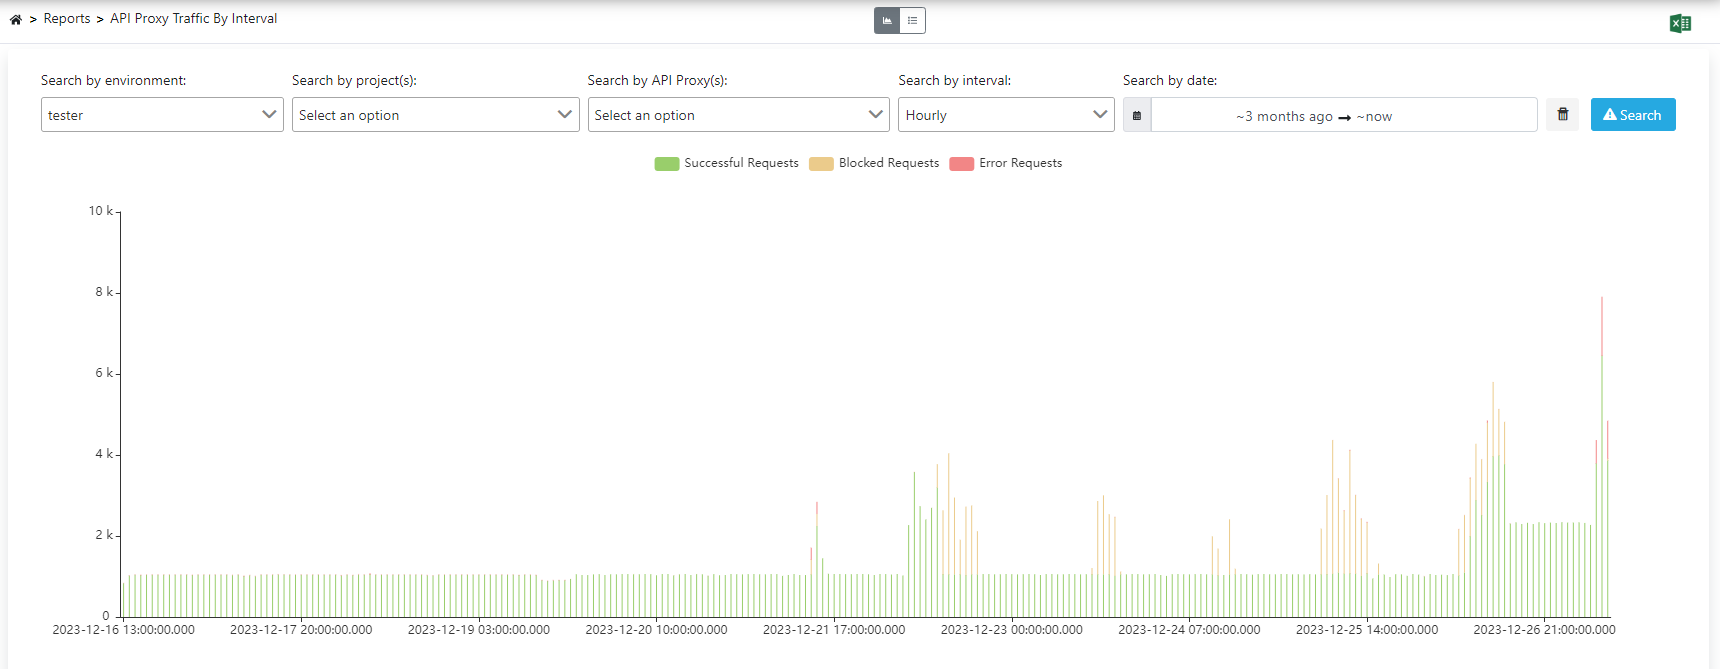
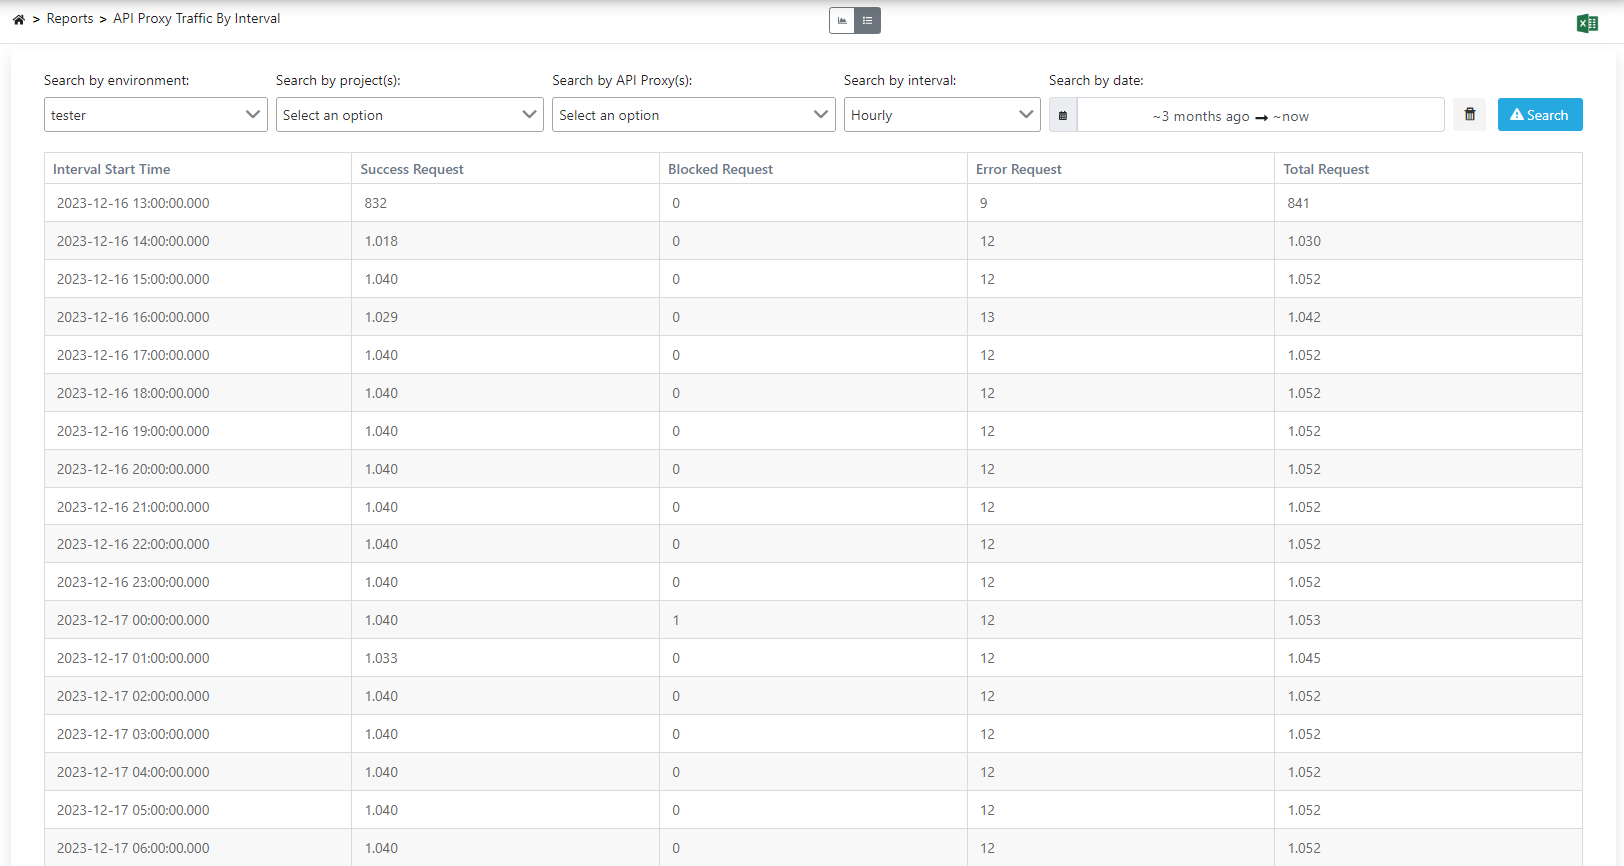
> You can visualize API traffic grouped by time in Apinizer. You can group incoming requests hourly, daily, monthly, or yearly and analyze them in graph or table views.
 Since WebSocket and gRPC requests are stored as data coming to Apinizer and data going out from Apinizer, there are only 2 regions in these types of API Proxies.