> ## Documentation Index
> Fetch the complete documentation index at: https://docs.apinizer.com/llms.txt
> Use this file to discover all available pages before exploring further.
# Client Traffic & Time Metrics
> You can view username-based traffic metrics in Apinizer. You can analyze client usage summaries grouped by username information of API Proxies in the project by API Proxy and endpoint, and export them in Excel format.
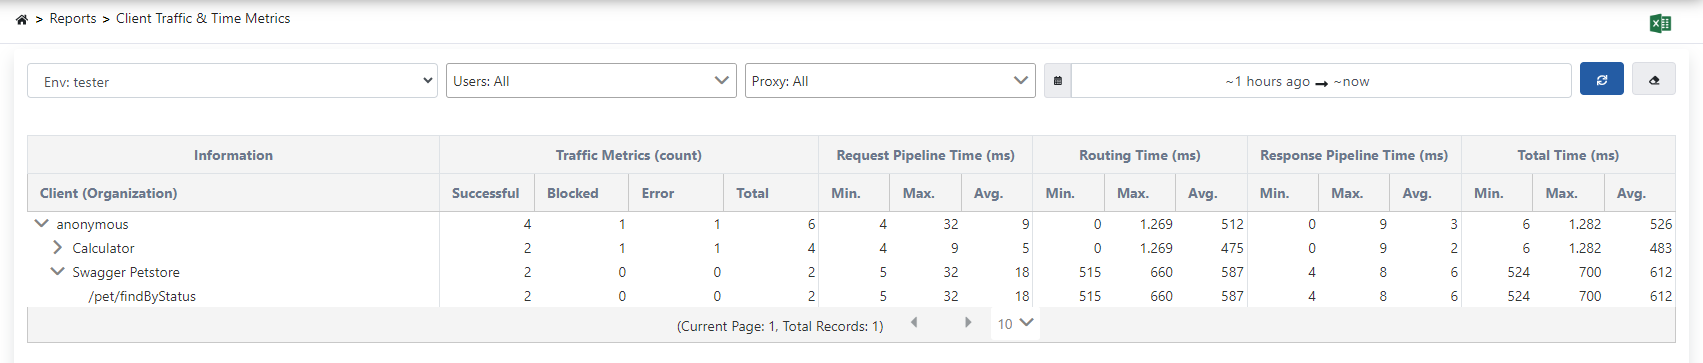 Since an API Proxy can be loaded into multiple environments, metrics must also be evaluated according to the environment it is loaded into. Therefore, in all analytics screens, metrics are filtered by first selecting environment information.
Requests sent without username are logged as **anonymous**. Data can be exported in Excel format with the Excel button in the upper right corner.
Since an API Proxy can be loaded into multiple environments, metrics must also be evaluated according to the environment it is loaded into. Therefore, in all analytics screens, metrics are filtered by first selecting environment information.
Requests sent without username are logged as **anonymous**. Data can be exported in Excel format with the Excel button in the upper right corner.