> ## Documentation Index
> Fetch the complete documentation index at: https://docs.apinizer.com/llms.txt
> Use this file to discover all available pages before exploring further.
# Endpoint Size Metrics
> You can analyze request and response size metrics of API Proxy endpoints in Apinizer. You can detect endpoints creating data traffic by grouping API Proxies in the project by method/endpoint information and take necessary actions for performance optimization.
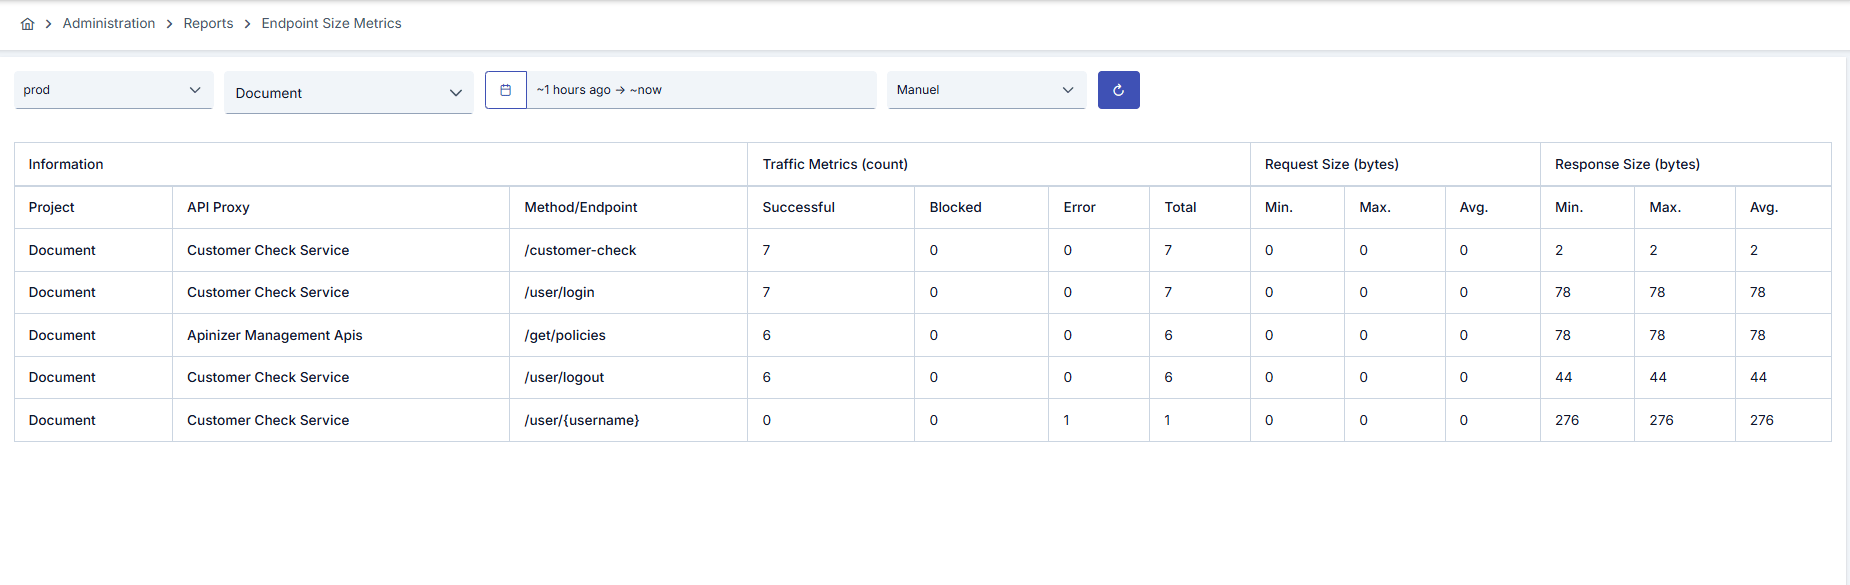 Since an API Proxy can be loaded into multiple environments, metrics must also be evaluated according to the environment it is loaded into. Therefore, in all analytics screens, metrics are filtered by first selecting environment information.
Metric data cannot be displayed for environments where Elasticsearch integration is not configured. In this case, a warning message is displayed on the screen.
## Filtering and Refresh Options
The following filtering and control options are available at the top of the page:
| Option | Description |
| ------------------------- | ----------------------------------------------------------------------------------------------- |
| **Environment Selection** | You can select the environment (environment) you want to see metrics for |
| **Project Selection** | (Only for Admin users) You can filter metrics by selecting multiple projects |
| **Date Range** | You can determine the time range you want to see your metrics |
| **Refresh Time** | You can select how often data will be automatically updated (Manual, 1 minute, 5 minutes, etc.) |
| **Refresh Button** | Used to refresh data instantly when manual refresh option is active |
## Table Column Descriptions
### Information
| Column | Description |
| ------------------- | ------------------------------------------------------- |
| **Project** | Name of the project (only in admin view) |
| **API Proxy** | Name of the API Proxy |
| **Method/Endpoint** | HTTP method and endpoint path (e.g., /pet/findByStatus) |
### Traffic Metrics (count)
* **Successful:** Number of requests resulting in successful (2xx) response code
* **Blocked:** Number of requests blocked due to security policies or rate limiting
* **Error:** Number of requests resulting in error (4xx, 5xx)
* **Total:** Total number of requests (Successful + Blocked + Error)
### Request Size (bytes)
Body size metrics of requests coming to the endpoint:
| Metric | Description |
| -------- | --------------------------------------- |
| **Min.** | Minimum request size (smallest request) |
| **Max.** | Maximum request size (largest request) |
| **Avg.** | Average request size |
### Response Size (bytes)
Body size metrics of responses returning from the endpoint:
| Metric | Description |
| -------- | ----------------------------------------- |
| **Min.** | Minimum response size (smallest response) |
| **Max.** | Maximum response size (largest response) |
| **Avg.** | Average response size |
Since an API Proxy can be loaded into multiple environments, metrics must also be evaluated according to the environment it is loaded into. Therefore, in all analytics screens, metrics are filtered by first selecting environment information.
Metric data cannot be displayed for environments where Elasticsearch integration is not configured. In this case, a warning message is displayed on the screen.
## Filtering and Refresh Options
The following filtering and control options are available at the top of the page:
| Option | Description |
| ------------------------- | ----------------------------------------------------------------------------------------------- |
| **Environment Selection** | You can select the environment (environment) you want to see metrics for |
| **Project Selection** | (Only for Admin users) You can filter metrics by selecting multiple projects |
| **Date Range** | You can determine the time range you want to see your metrics |
| **Refresh Time** | You can select how often data will be automatically updated (Manual, 1 minute, 5 minutes, etc.) |
| **Refresh Button** | Used to refresh data instantly when manual refresh option is active |
## Table Column Descriptions
### Information
| Column | Description |
| ------------------- | ------------------------------------------------------- |
| **Project** | Name of the project (only in admin view) |
| **API Proxy** | Name of the API Proxy |
| **Method/Endpoint** | HTTP method and endpoint path (e.g., /pet/findByStatus) |
### Traffic Metrics (count)
* **Successful:** Number of requests resulting in successful (2xx) response code
* **Blocked:** Number of requests blocked due to security policies or rate limiting
* **Error:** Number of requests resulting in error (4xx, 5xx)
* **Total:** Total number of requests (Successful + Blocked + Error)
### Request Size (bytes)
Body size metrics of requests coming to the endpoint:
| Metric | Description |
| -------- | --------------------------------------- |
| **Min.** | Minimum request size (smallest request) |
| **Max.** | Maximum request size (largest request) |
| **Avg.** | Average request size |
### Response Size (bytes)
Body size metrics of responses returning from the endpoint:
| Metric | Description |
| -------- | ----------------------------------------- |
| **Min.** | Minimum response size (smallest response) |
| **Max.** | Maximum response size (largest response) |
| **Avg.** | Average response size |