> ## Documentation Index
> Fetch the complete documentation index at: https://docs.apinizer.com/llms.txt
> Use this file to discover all available pages before exploring further.
# API Traffic Settings
> You can configure API Proxy traffic logs by message region, manage project and environment-based log settings, and route traffic records to multiple integration targets. In the edit dialog you can select a connector and define log content, request-response flow details, and privacy options independently for each target.
## Log Record Regions
Message information coming to and going from API Proxies defined on Apinizer is logged in Elasticsearch database according to message elements (header, parameter, body).
These log record regions:
Request information coming from client to API Proxy
Request information sent from API Proxy to Backend API
Response information given from Backend API to API Proxy
Response information sent from API Proxy to client
By default, logging of fields in all message regions of the project is active. Logged fields can be restricted based on need or log server resource consumption.
Log settings are managed on a project and environment (environment) basis through this screen.
For production environment, it is recommended to disable logging of elements belonging to the following regions.
* From API Proxy to Backend API (Request to Target)
* From Backend API to API Proxy (Response from Target)
If an API Proxy is running in production environment, it means that all policy settings and tests in the API Proxy are completed and no more development will be done.
Therefore, to prevent excessive growth of data in the database, it is recommended not to write header, parameter, and body data in these two regions.
Even if all logging fields are closed, if an error occurs in the request, all log fields are recorded to detect the error. This feature can be opened and closed in general settings.
Due to variable data sizes and data formats, file parts of formdata requests are never logged. Only other metadata fields are logged.
Since WebSocket and gRPC requests are stored as data coming to Apinizer and data going out from Apinizer, there are only 2 regions in these types of API Proxies.
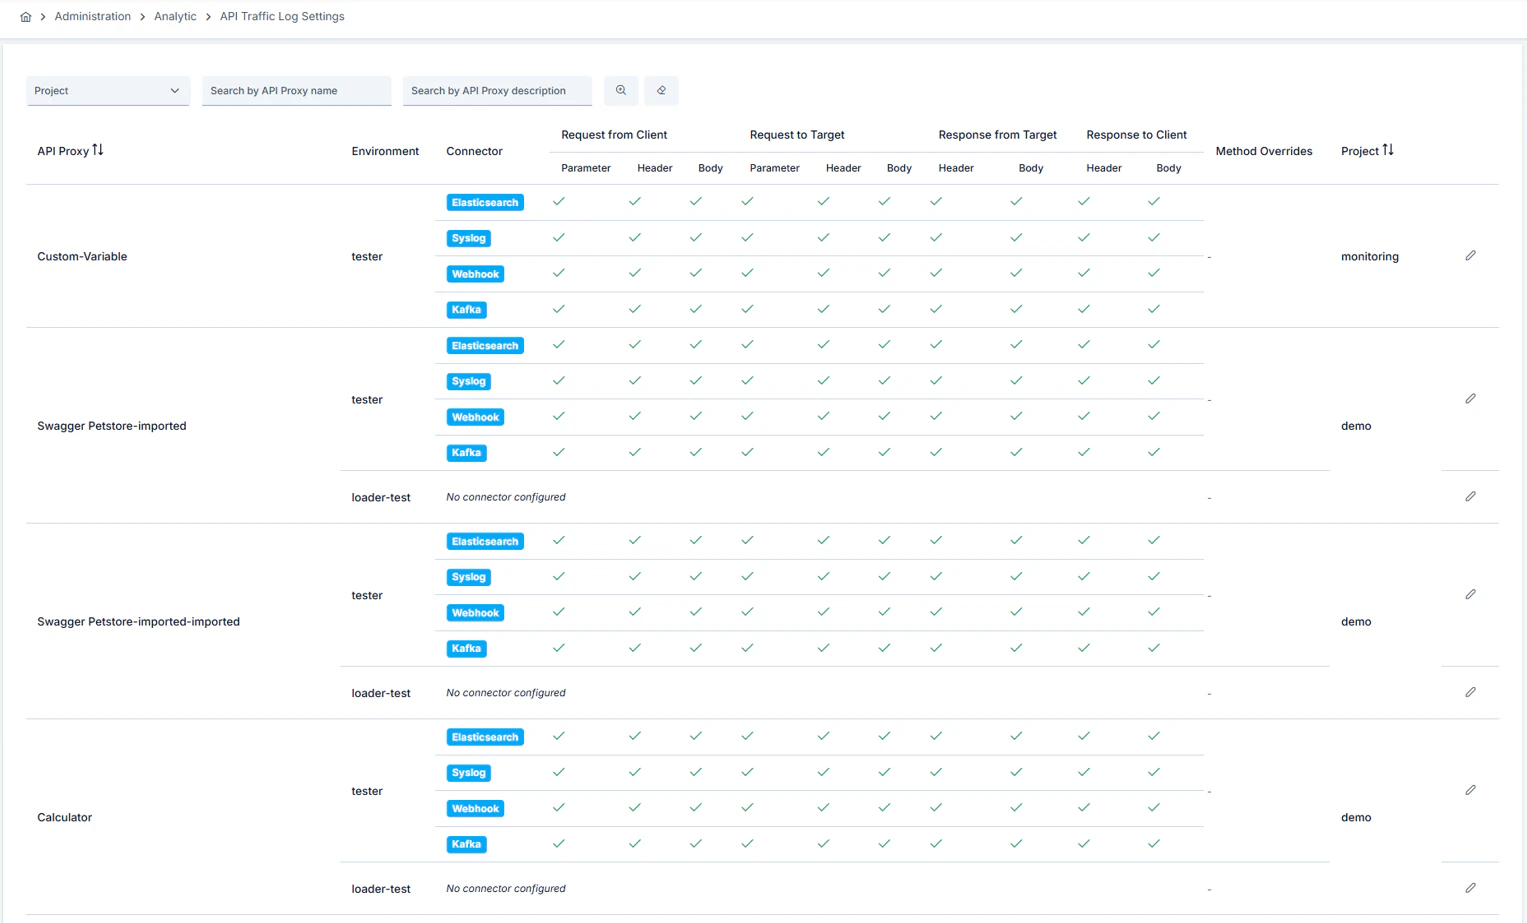 On this screen you can manage [API Proxy](/en/concepts/core-concepts/what-is-api-proxy)-based traffic log settings. When [connectors](/en/concepts/core-concepts/connector) are defined on the [environment](/en/concepts/core-concepts/what-is-environment), you can control whether each proxy sends traffic records to those targets.
### Edit dialog (Edit API Traffic Proxy Log Settings)
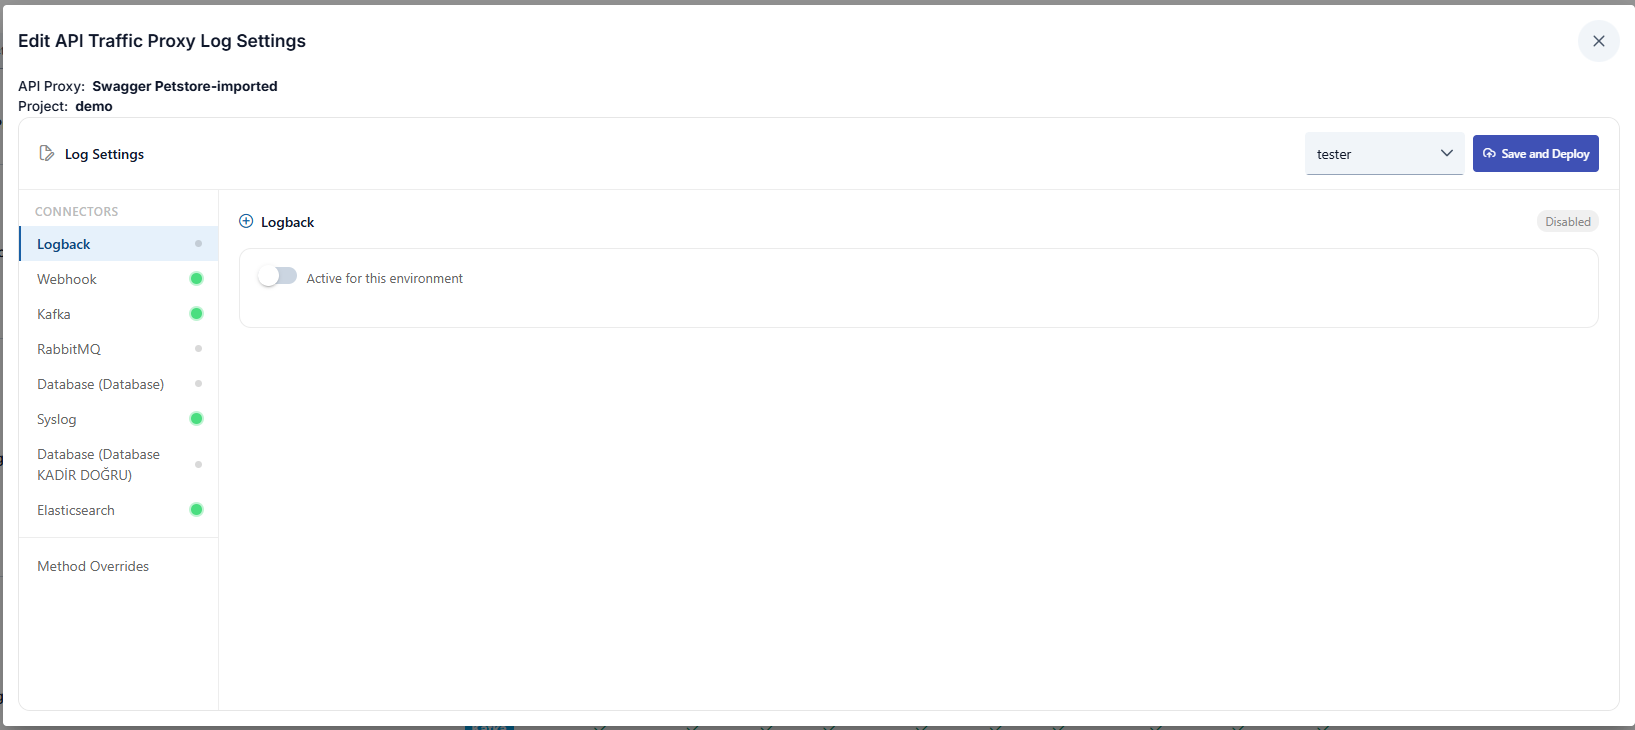
Opening **Edit** on a row shows a dialog with a **CONNECTORS** menu on the left (Logback, Webhook, Kafka, RabbitMQ, database, Syslog, Elasticsearch, and so on). Selecting an item loads that target’s configuration on the right. At the top you choose the environment and use **Save and Deploy**; on each connector card, **Active for this environment** turns sending on or off for the selected environment. The colored status dot next to a connector reflects its configuration state at a glance. Use **Method Overrides** for method-level overrides.
On this screen you can manage [API Proxy](/en/concepts/core-concepts/what-is-api-proxy)-based traffic log settings. When [connectors](/en/concepts/core-concepts/connector) are defined on the [environment](/en/concepts/core-concepts/what-is-environment), you can control whether each proxy sends traffic records to those targets.
### Edit dialog (Edit API Traffic Proxy Log Settings)
Opening **Edit** on a row shows a dialog with a **CONNECTORS** menu on the left (Logback, Webhook, Kafka, RabbitMQ, database, Syslog, Elasticsearch, and so on). Selecting an item loads that target’s configuration on the right. At the top you choose the environment and use **Save and Deploy**; on each connector card, **Active for this environment** turns sending on or off for the selected environment. The colored status dot next to a connector reflects its configuration state at a glance. Use **Method Overrides** for method-level overrides.
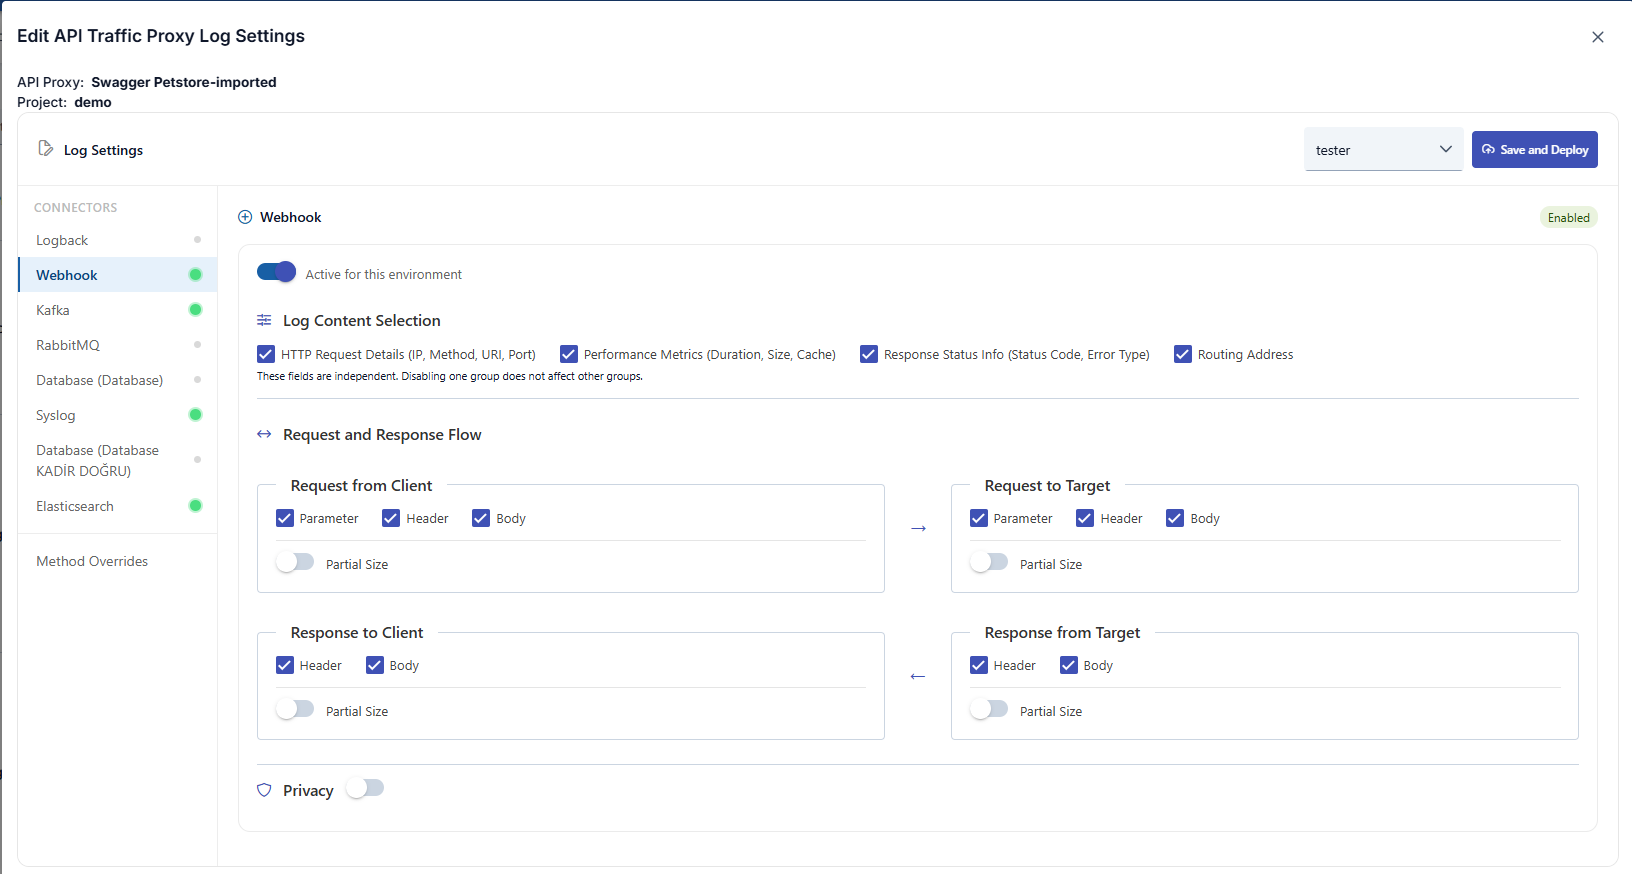
 For the selected connector, the **Log content** section lets you toggle high-level groups such as HTTP request details, performance metrics, response status, and routing address; these groups are independent. In **Request from Client**, **Request to Target**, **Response from Target**, and **Response to Client**, you configure Parameter, Header, and Body (and **Partial size** where available) per message region. At the bottom, **Privacy** toggles privacy processing for this flow.
 When a database connector is selected as the log target, the log tables’ schema prefix or custom table name is configured in the **connection** definition. For details, see the [Database connection](/en/integrations/connection-management/database) page.
## Log Settings Fields
The main fields used in log settings are summarized below.
| Field | Description |
| --------------------------- | ---------------------------------------------------------------------------------------------------------- |
| Active for this environment | Turns sending traffic logs to this log target on or off for the selected environment. |
| HTTP request details | Controls inclusion of client IP, HTTP method, URI, port, and related request metadata in the log. |
| Performance metrics | Controls whether duration, message size, cache-related metrics, and similar values are written to the log. |
| Response status info | Controls inclusion of HTTP status code, error type, and related fields in the log. |
| Routing address | Controls whether routing or destination address information is written to the log. |
| Header | For each message region, controls whether header information is logged. |
| Body | For each message region, controls whether body content is logged. |
| Parameter | For each message region, controls whether parameter information is logged. |
| Partial size | For each message region, controls whether long text fields are truncated or size-limited when logged. |
| Privacy | Controls whether environment-level privacy rules apply to log data sent through this connector. |
When a database connector is selected as the log target, the log tables’ schema prefix or custom table name is configured in the **connection** definition. For details, see the [Database connection](/en/integrations/connection-management/database) page.
## Log Settings Fields
The main fields used in log settings are summarized below.
| Field | Description |
| --------------------------- | ---------------------------------------------------------------------------------------------------------- |
| Active for this environment | Turns sending traffic logs to this log target on or off for the selected environment. |
| HTTP request details | Controls inclusion of client IP, HTTP method, URI, port, and related request metadata in the log. |
| Performance metrics | Controls whether duration, message size, cache-related metrics, and similar values are written to the log. |
| Response status info | Controls inclusion of HTTP status code, error type, and related fields in the log. |
| Routing address | Controls whether routing or destination address information is written to the log. |
| Header | For each message region, controls whether header information is logged. |
| Body | For each message region, controls whether body content is logged. |
| Parameter | For each message region, controls whether parameter information is logged. |
| Partial size | For each message region, controls whether long text fields are truncated or size-limited when logged. |
| Privacy | Controls whether environment-level privacy rules apply to log data sent through this connector. |