> ## Documentation Index
> Fetch the complete documentation index at: https://docs.apinizer.com/llms.txt
> Use this file to discover all available pages before exploring further.
# API Traffic
> You can list requests and responses coming to all API Proxies in the project with their details. You can investigate problems in messages, perform filtering, detailed viewing, JSON format viewing, download, and quick test operations.
The API Traffic screen lists requests and responses coming to all API Proxies in the project with their details. This screen particularly facilitates investigating problems in messages.
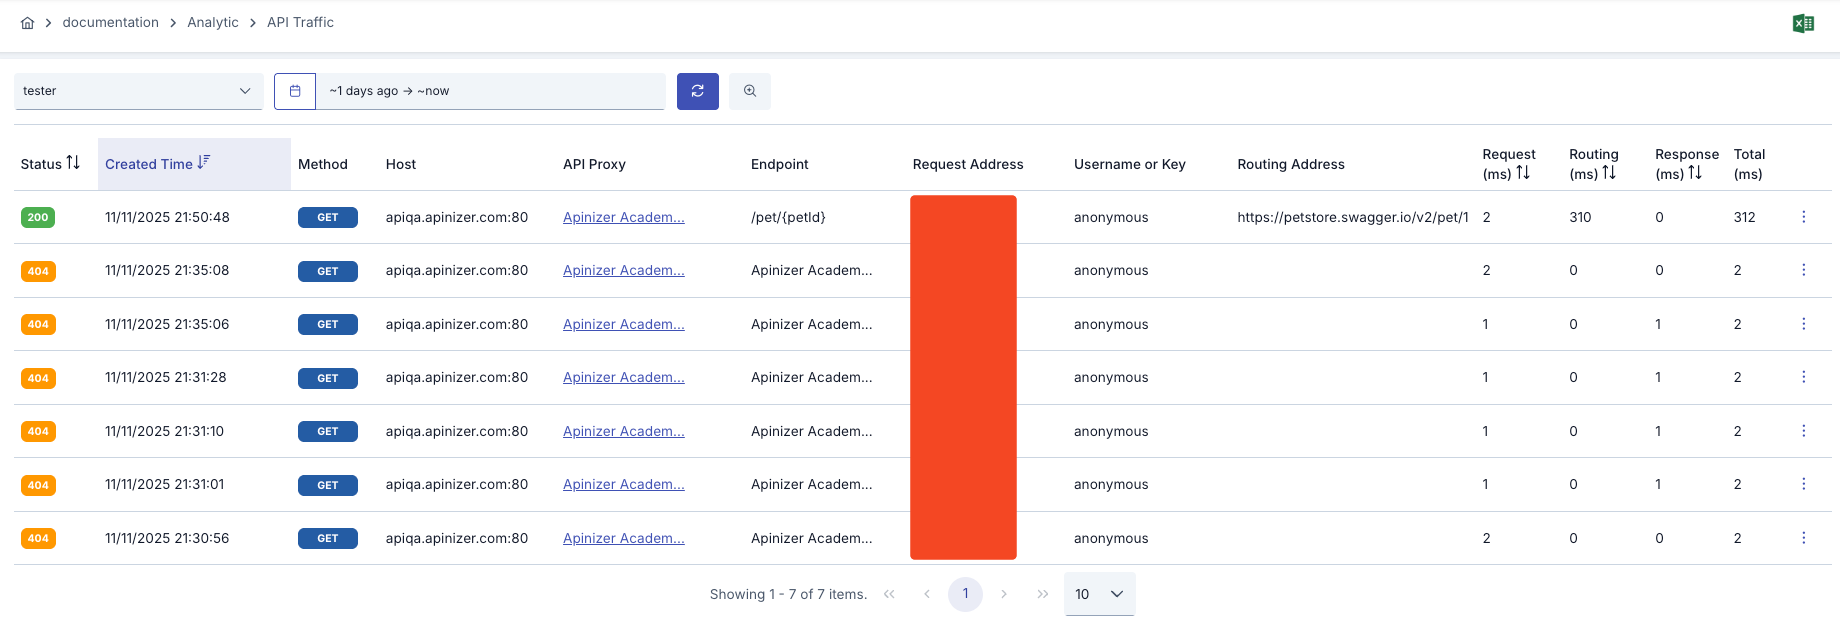 Since an API Proxy can be loaded into multiple [Environments](/en/concepts/core-concepts/what-is-environment), metrics are queried based on environment. In all analytics screens, metrics are filtered by first selecting **Environment information**.
## Features
You can view traffic of all API Proxies in the project on a single screen
You can reach the records you want with simple and advanced filtering options
You can examine each request's message flow in detail by sections
You can track how requests are routed to which addresses
You can view and download log records in JSON format
You can quickly retest requests by transferring them to Test Console
## Routing Address
This field holds the address information to which the relevant API Proxy is routed. If this field is empty, it indicates that the request did not go to the backend address.
Services using Apinizer as backend are shown with the `apinizer://` prefix, written exactly in the format `apinizer:///`.
This display is also valid for proxies whose routing is disabled to prevent going to backend.
### Routing Address Values
| Routing Address | Condition |
| ----------------------------------------------------------------------------------------- | ------------------------------------------------------------------------------------------------------------------------------------------------ |
| `apinizer://mirror.routing/` | API Proxy type Swagger 2.x, OpenAPI/Swagger 3.0.x, WSDL, Reverse Proxy or No-Spec API and **Routing option disabled and Mirror option enabled** |
| `apinizer://specresponse.routing/` | API Proxy type Swagger 2.x, OpenAPI/Swagger 3.0.x, WSDL, Reverse Proxy or No-Spec API and **Routing option disabled and Mirror option disabled** |
| `apinizer://db2api.apicreator/` | API Proxy type DB2API |
| `apinizer://script2api.apicreator/` | API Proxy type Script2API |
| `apinizer://mockapi.apicreator/` | API Proxy type Mock API |
| `apinizer://connector/` | API Proxy type Connector |
| `apinizer://maintenance` | API Proxy in maintenance mode |
| `apinizer://cache/` | Any API Proxy type and **Caching enabled** |
| `http:///`
Since an API Proxy can be loaded into multiple [Environments](/en/concepts/core-concepts/what-is-environment), metrics are queried based on environment. In all analytics screens, metrics are filtered by first selecting **Environment information**.
## Features
You can view traffic of all API Proxies in the project on a single screen
You can reach the records you want with simple and advanced filtering options
You can examine each request's message flow in detail by sections
You can track how requests are routed to which addresses
You can view and download log records in JSON format
You can quickly retest requests by transferring them to Test Console
## Routing Address
This field holds the address information to which the relevant API Proxy is routed. If this field is empty, it indicates that the request did not go to the backend address.
Services using Apinizer as backend are shown with the `apinizer://` prefix, written exactly in the format `apinizer:///`.
This display is also valid for proxies whose routing is disabled to prevent going to backend.
### Routing Address Values
| Routing Address | Condition |
| ----------------------------------------------------------------------------------------- | ------------------------------------------------------------------------------------------------------------------------------------------------ |
| `apinizer://mirror.routing/` | API Proxy type Swagger 2.x, OpenAPI/Swagger 3.0.x, WSDL, Reverse Proxy or No-Spec API and **Routing option disabled and Mirror option enabled** |
| `apinizer://specresponse.routing/` | API Proxy type Swagger 2.x, OpenAPI/Swagger 3.0.x, WSDL, Reverse Proxy or No-Spec API and **Routing option disabled and Mirror option disabled** |
| `apinizer://db2api.apicreator/` | API Proxy type DB2API |
| `apinizer://script2api.apicreator/` | API Proxy type Script2API |
| `apinizer://mockapi.apicreator/` | API Proxy type Mock API |
| `apinizer://connector/` | API Proxy type Connector |
| `apinizer://maintenance` | API Proxy in maintenance mode |
| `apinizer://cache/` | Any API Proxy type and **Caching enabled** |
| `http:///`
`https:///` | API Proxy type Swagger 2.x, OpenAPI/Swagger 3.0.x, WSDL, Reverse Proxy, No-Spec API or KPS and **Routing option enabled** |
| `apinizer://spec` | API Proxy type Swagger 2.x, OpenAPI/Swagger 3.0.x, WSDL, Reverse Proxy, No-Spec API and spec address access |
| *(Empty)* | Request cannot go to backend address for various reasons |
Since WebSocket and gRPC requests are stored as data coming to Apinizer and data going out from Apinizer, there are only 2 regions in these types of API Proxies.
## Filtering
With the **"More options"** option, 2 different types of filtering can be performed:
Records can be filtered with predetermined criteria such as a specific time range, endpoint, or HTTP method.
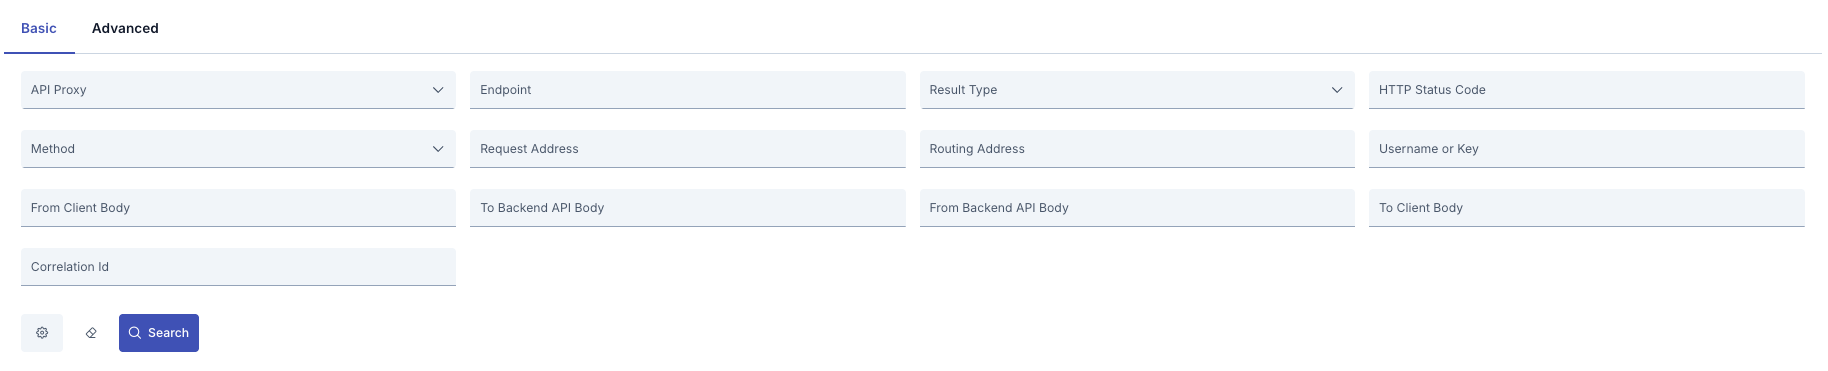 **Filtering Criteria:**
* **Date Range**: Start and end date selection
* **API Proxy**: Filtering for specific API Proxies
* **Endpoint/Method**: Filtering for specific endpoint or method
* **HTTP Method**: GET, POST, PUT, DELETE, etc.
* **Status Code**: HTTP status codes such as 200, 404, 500
* **Result Type**: Successful, Failed, Blocked
Users can create nested filters and perform complex queries.
**Filtering Criteria:**
* **Date Range**: Start and end date selection
* **API Proxy**: Filtering for specific API Proxies
* **Endpoint/Method**: Filtering for specific endpoint or method
* **HTTP Method**: GET, POST, PUT, DELETE, etc.
* **Status Code**: HTTP status codes such as 200, 404, 500
* **Result Type**: Successful, Failed, Blocked
Users can create nested filters and perform complex queries.
 The advanced filter creation tab is activated if there is an **advanced license** on analytics.
**Advanced Filtering Options:**
* **API Proxy**: Multiple API Proxy selection
* **Method/Endpoint Name**: Method/Endpoint Name
* **HTTP Method**: HTTP Method
* **HTTP Status Code**: HTTP Status Code
* **Operation Result Type**: Result Type
* **Request Address**: Request Address
* **Sent Address**: Routing Address
* **Username or Key**: Username or Key
* **Correlation ID**: Apinizer Correlation ID
* **Request Body from Client**: From Client Body
* **Request Body to Backend API**: To Backend API Body
* **Response Body from Backend API**: From Backend API Body
* **Response Body to Client**: To Client Body
* Complex queries with **AND/OR/NOT** operators
### Query Types
2 types of queries are applied to filtered fields:
Logs where the searched value (keyword) **exactly matches** the logged data are returned.
**Fields where this query is applied:**
* API Proxy
* Operation Result Type (Result Type)
* HTTP Status Code (HTTP Status Code)
* HTTP Method (HTTP Method)
* Username or Key (Username or Key)
* Correlation ID
It is a query that searches across all text. The searched value is **analyzed** before searching.
**Analysis Process:**
1. Text is broken into parts according to grammar rules (numbers, punctuation marks, etc.)
2. Parts pass through the 'Lower Case Token Filter' stage and are converted to lowercase
3. Example: `'The 2 QUICK Brown-Foxes jumped over the lazy dog's bone.'` → `[ the, 2, quick, brown, foxes, jumped, over, the, lazy, dog's, bone ]`
**Matching Logic:**
* There is an **OR** operator between parts
* A **score value** is obtained based on criteria such as how many parts are in the field in the log document and how frequently they are used
* Relevant documents are returned according to this score value
**Fields where this query is applied:**
* Method/Endpoint Name (Method/Endpoint Name)
* Request Address (Request Address)
* Sent Address (Routing Address)
* Request Body from Client (From Client Body)
* Response Body to Client (To Client Body)
Documents containing terms matching a wildcard character pattern are returned.
**Usage:**
* The `*` character must be added before or after the word to expand your search results
* Example: `user*` → all words starting with user
* Example: `*admin` → all words ending with admin
**Fields where this query is applied:**
* Request Address (Request Address)
* Sent Address (Routing Address)
The following rules apply when searching in the **From Client Body**, **To Backend API Body**, **From Backend API Body**, and **To Client Body** fields:
**Single-word search:**
* Expressions without spaces, such as `birth`, work as wildcard substring search — all records containing that word are returned.
**Multi-word phrase search:**
* Expressions containing spaces, such as `date of birth`, search for records where the words appear **adjacent to each other** — phrase search behavior.
* Wildcards can also be combined: `*date of birth*`
For the most accurate results, use the exact wording of the text you are looking for. Prefer using the exact casing as written in the original message.
## Detailed View
When the **Detailed View** button on the right side of the log record is pressed, the message's log information comes grouped by sections in the request and response line.
The advanced filter creation tab is activated if there is an **advanced license** on analytics.
**Advanced Filtering Options:**
* **API Proxy**: Multiple API Proxy selection
* **Method/Endpoint Name**: Method/Endpoint Name
* **HTTP Method**: HTTP Method
* **HTTP Status Code**: HTTP Status Code
* **Operation Result Type**: Result Type
* **Request Address**: Request Address
* **Sent Address**: Routing Address
* **Username or Key**: Username or Key
* **Correlation ID**: Apinizer Correlation ID
* **Request Body from Client**: From Client Body
* **Request Body to Backend API**: To Backend API Body
* **Response Body from Backend API**: From Backend API Body
* **Response Body to Client**: To Client Body
* Complex queries with **AND/OR/NOT** operators
### Query Types
2 types of queries are applied to filtered fields:
Logs where the searched value (keyword) **exactly matches** the logged data are returned.
**Fields where this query is applied:**
* API Proxy
* Operation Result Type (Result Type)
* HTTP Status Code (HTTP Status Code)
* HTTP Method (HTTP Method)
* Username or Key (Username or Key)
* Correlation ID
It is a query that searches across all text. The searched value is **analyzed** before searching.
**Analysis Process:**
1. Text is broken into parts according to grammar rules (numbers, punctuation marks, etc.)
2. Parts pass through the 'Lower Case Token Filter' stage and are converted to lowercase
3. Example: `'The 2 QUICK Brown-Foxes jumped over the lazy dog's bone.'` → `[ the, 2, quick, brown, foxes, jumped, over, the, lazy, dog's, bone ]`
**Matching Logic:**
* There is an **OR** operator between parts
* A **score value** is obtained based on criteria such as how many parts are in the field in the log document and how frequently they are used
* Relevant documents are returned according to this score value
**Fields where this query is applied:**
* Method/Endpoint Name (Method/Endpoint Name)
* Request Address (Request Address)
* Sent Address (Routing Address)
* Request Body from Client (From Client Body)
* Response Body to Client (To Client Body)
Documents containing terms matching a wildcard character pattern are returned.
**Usage:**
* The `*` character must be added before or after the word to expand your search results
* Example: `user*` → all words starting with user
* Example: `*admin` → all words ending with admin
**Fields where this query is applied:**
* Request Address (Request Address)
* Sent Address (Routing Address)
The following rules apply when searching in the **From Client Body**, **To Backend API Body**, **From Backend API Body**, and **To Client Body** fields:
**Single-word search:**
* Expressions without spaces, such as `birth`, work as wildcard substring search — all records containing that word are returned.
**Multi-word phrase search:**
* Expressions containing spaces, such as `date of birth`, search for records where the words appear **adjacent to each other** — phrase search behavior.
* Wildcards can also be combined: `*date of birth*`
For the most accurate results, use the exact wording of the text you are looking for. Prefer using the exact casing as written in the original message.
## Detailed View
When the **Detailed View** button on the right side of the log record is pressed, the message's log information comes grouped by sections in the request and response line.
 ### Message Regions
The log record is grouped according to the following regions:
Summary information of the request, status code, total duration, and general metrics
* Request Headers
* Request Parameters
* Request Body
* Client IP and metadata
* Backend URL and routing information
* Sent Headers
* Sent Body
* Routing details
* Response Status Code
* Response Headers
* Response Body
* Backend response time
* Headers returned to client
* Body returned to client
* Total processing time
By default, the **Overview** section is open. When the name of the section to be examined is clicked, log records related to that area are displayed.
## JSON View
When the **JSON View** button on the right side of the record is pressed, the JSON version of the log record appears on the screen.
### Message Regions
The log record is grouped according to the following regions:
Summary information of the request, status code, total duration, and general metrics
* Request Headers
* Request Parameters
* Request Body
* Client IP and metadata
* Backend URL and routing information
* Sent Headers
* Sent Body
* Routing details
* Response Status Code
* Response Headers
* Response Body
* Backend response time
* Headers returned to client
* Body returned to client
* Total processing time
By default, the **Overview** section is open. When the name of the section to be examined is clicked, log records related to that area are displayed.
## JSON View
When the **JSON View** button on the right side of the record is pressed, the JSON version of the log record appears on the screen.
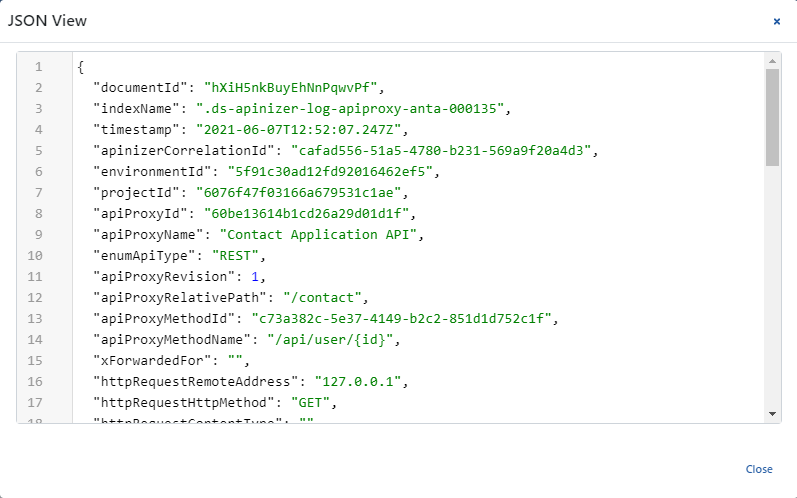 The key values in this area are written in a **readable format** to facilitate reading, not as they are in the log file.
For example:
* The "apiProxyId" value is stored as "api" in the log record
* When the log record is downloaded, the actual stored log record will be displayed
For the actual log file format, you can examine the "Template Data Structure Table" on the [API Traffic Log Record Data Structure](/en/analytic/api-traffic-log-record-data-structure) page.
If the data size of the log record is greater than **500KB**, the **Show Details** and **View in JSON Format** options become disabled. In this case, the log record **must be downloaded** for examination.
## Log Record Download
When the **Download** button on the right side of the record is pressed, the JSON version of the record is downloaded in `.zip` format.
**Download Options:**
* **Single Record**: Downloads the selected record
* **All Results**: Downloads all filtered records
Downloaded log files can be used for detailed analysis or processing with external tools.
## Quick Test
When the **Quick Test** button on the right side of the record is pressed, the Test Console screen opens with the original message content that came to the record placed in the [Test Console](/en/develop/test-debug-tools/test-console).
This feature facilitates retesting the relevant record.
The **Quick Test** button must be **enabled** in general settings to appear.
## Related Resources
Traffic tab of a single API Proxy
API Proxy performance metrics and visualization
Detailed trace and debug operations
Advanced query and filter definitions
Log record configurations
API traffic log record data structure
The key values in this area are written in a **readable format** to facilitate reading, not as they are in the log file.
For example:
* The "apiProxyId" value is stored as "api" in the log record
* When the log record is downloaded, the actual stored log record will be displayed
For the actual log file format, you can examine the "Template Data Structure Table" on the [API Traffic Log Record Data Structure](/en/analytic/api-traffic-log-record-data-structure) page.
If the data size of the log record is greater than **500KB**, the **Show Details** and **View in JSON Format** options become disabled. In this case, the log record **must be downloaded** for examination.
## Log Record Download
When the **Download** button on the right side of the record is pressed, the JSON version of the record is downloaded in `.zip` format.
**Download Options:**
* **Single Record**: Downloads the selected record
* **All Results**: Downloads all filtered records
Downloaded log files can be used for detailed analysis or processing with external tools.
## Quick Test
When the **Quick Test** button on the right side of the record is pressed, the Test Console screen opens with the original message content that came to the record placed in the [Test Console](/en/develop/test-debug-tools/test-console).
This feature facilitates retesting the relevant record.
The **Quick Test** button must be **enabled** in general settings to appear.
## Related Resources
Traffic tab of a single API Proxy
API Proxy performance metrics and visualization
Detailed trace and debug operations
Advanced query and filter definitions
Log record configurations
API traffic log record data structure