> ## Documentation Index
> Fetch the complete documentation index at: https://docs.apinizer.com/llms.txt
> Use this file to discover all available pages before exploring further.
# Dashboard
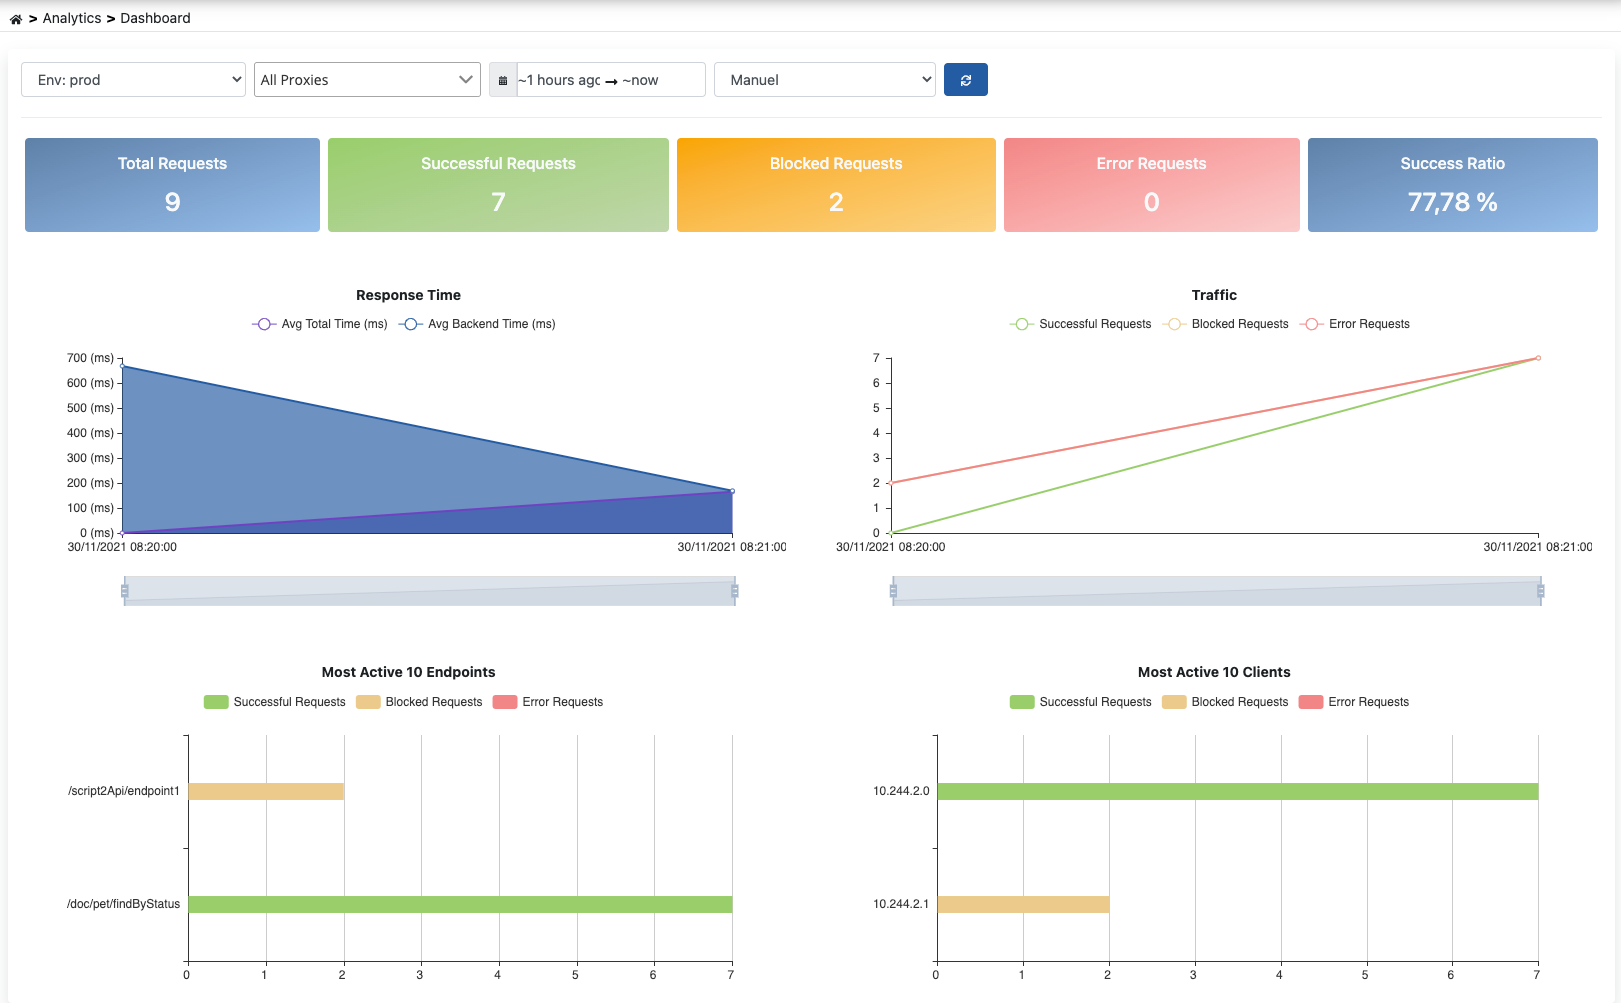
> You can monitor the general status of API Proxies, view metrics created from log data. You can perform environment-based queries, perform live monitoring with automatic refresh feature, and analyze performance, traffic, and error metrics.
The Analytics Dashboard visualizes metrics created from log data of API Proxies within the project. The dashboard provides monitoring of API Proxy general status and performance analysis.
 Querying and analytical visualization of API Traffic in Apinizer Management Console is only possible by adding an [Elasticsearch Connector](/en/integrations/connection-management/elasticsearch-monitor) to the relevant environment.
Since an API Proxy can be loaded into multiple [Environments](/en/concepts/core-concepts/what-is-environment), metrics are **queried based on environment**. Environment selection must be made from the top of the page.
## Features
You can view the general status of API Proxies, total request count, success/error rates
You can analyze response times, processing times, and backend performance metrics
You can monitor API traffic over time, detect peak periods
You can monitor error rates, error types, and problematic endpoints
You can track metrics live by activating the page's automatic refresh feature
You can view separate metrics for different environments
Metrics on the screen can be automatically refreshed using the **Automatic Refresh** option at the top of the page.
## Dashboard Metrics
The dashboard includes the following main metric categories:
### General Metrics
| Metric | Description |
| ---------------------------- | ---------------------------------------------------------------- |
| **Total Request Count** | Total number of API requests received in the selected time range |
| **Successful Request Count** | Requests returning with HTTP 2xx status code |
| **Failed Request Count** | Requests returning with HTTP 4xx and 5xx status code |
| **Success Rate** | Ratio of successful requests to total requests (%) |
| **Error Rate** | Ratio of failed requests to total requests (%) |
| **Average Response Time** | Average response time of all requests (ms) |
### Traffic Metrics
* Change in request count over time (line chart)
* Detection of peak periods
* Trend analysis
* Which API Proxies are used how much
* Usage intensity comparison
* Most used APIs
* Most called endpoints
* Endpoint usage statistics
* Call count ranking
* Usage rates of GET, POST, PUT, DELETE methods
* Request counts by method
### Performance Metrics
* Average response time of all requests
* Change in response time over time
* Performance trend analysis
* Response times in different time ranges
* P50, P95, P99 percentile values
* Min/Max response times
* Response times of backend APIs
* Backend connection times
* Upstream performance metrics
* Endpoints with highest response times
* APIs requiring optimization
### Error Metrics
* 2xx, 4xx, 5xx status code rates
* Success/Error distribution (pie chart)
* Authentication errors
* Routing errors
* Policy errors
* Backend errors
* API Proxies with high error rates
* Problematic endpoints
* Change in error rate over time
* Detection of error spikes
### Client Metrics
* Clients sending most requests
* Request counts by client
* Analysis by Client IP/Key
* Success/error rates by client
* Blocked/Throttled clients
## Automatic Refresh
The dashboard enables live tracking of metrics with the automatic refresh feature.
Select the refresh interval from the **Automatic Refresh** dropdown menu at the top of the page
* 10 seconds
* 30 seconds
* 1 minute
* 5 minutes
Metrics on the screen are automatically refreshed at the selected interval
When automatic refresh is active, metrics continue to update at regular intervals until the page is changed.
Very short refresh intervals (10-30 seconds) can create additional load on Elasticsearch. Intervals of 1-5 minutes are recommended for production environments.
## Environment-Based Querying
Dashboard metrics are queried based on environment. Separate metrics are displayed for each environment.
### Environment Selection
Open the environment selector dropdown at the top of the page
Select the environment you want to see metrics for (Development, Test, Production, etc.)
Metrics for the selected environment are automatically loaded and displayed
Different environments may be connected to different Elasticsearch connectors. If multiple Elasticsearch Connectors are defined, data from the **first** Elasticsearch Connector added in Apinizer Management Console is displayed.
### Time Range Filtering
You can select a time range for metrics:
| Time Range | Description |
| ------------------- | ------------------------------- |
| **Last 15 Minutes** | Ideal for real-time monitoring |
| **Last 1 Hour** | Short-term performance analysis |
| **Last 24 Hours** | Daily traffic analysis |
| **Last 7 Days** | Weekly trend analysis |
| **Last 30 Days** | Monthly usage statistics |
| **Custom Range** | Start and end date selection |
Short time ranges (15 minutes - 1 hour) are suitable for real-time monitoring, while long time ranges (7-30 days) are suitable for trend analysis and capacity planning.
## Metric Interpretation and Usage
You can monitor the health of your APIs by correctly interpreting dashboard metrics.
### Success Rate Interpretation
| Success Rate | Status | Recommended Actions |
| ------------ | --------- | ---------------------------------------------------------- |
| **> 99%** | Very Good | Continue normal monitoring |
| **95-99%** | Good | Monitor errors, make minor improvements |
| **90-95%** | Attention | Analyze error causes, plan fixes |
| **\< 90%** | Critical | Immediate intervention required, perform detailed analysis |
### Response Time Interpretation
| Average Response Time | Status | Recommended Actions |
| --------------------- | --------- | ------------------------------------------ |
| **\< 100ms** | Excellent | Maintain current performance |
| **100-500ms** | Good | Evaluate optimization opportunities |
| **500ms-2s** | Slow | Perform performance optimization |
| **> 2s** | Critical | Immediate optimization required, use cache |
### Traffic Analysis
**Peak Periods:**
* Which hours have heavy traffic?
* Which days receive more requests?
* Should capacity planning be done?
**Sudden Increases (Spikes):**
* Are there unexpected traffic increases?
* Is there suspicion of DDoS attack?
* Is rate limiting sufficient?
**Trend Changes:**
* Is traffic increasing / decreasing?
* Are there seasonal changes?
* How is the impact of new feature launch?
## Problem Detection and Resolution
You can detect and resolve common problems with the dashboard.
### High Error Rate
**Problem Detection:**
* Error rate above 5%
* High 4xx/5xx rate in Status Code Distribution
* Concentrated errors on specific endpoints
**Analysis Steps:**
1. Check the **APIs with Most Errors** metric
2. Filter failed requests from the [API Traffic](/en/analytic/api-traffic) page
3. Perform detailed error analysis with [Tracing](/en/analytic/tracing)
**Possible Solutions:**
* Backend API issues → Inform backend team
* Authentication errors → Check credentials
* Validation errors → Fix request format
### Slow Performance
**Problem Detection:**
* Average response time increased
* Problematic APIs in Slowest Endpoints list
* Low backend performance
**Analysis Steps:**
1. Review the **Slowest Endpoints** metric
2. Analyze policy performance with [Tracing](/en/analytic/tracing)
3. Check backend response times
**Possible Solutions:**
* Add cache policy
* Optimize database queries
* Adjust backend timeout values
* Optimize or remove slow policies
### Abnormal Traffic Increase
**Problem Detection:**
* Sudden and unexpected request increase
* Heavy requests from specific IPs
* Rate limit violations
**Analysis Steps:**
1. Detect spikes in the **Request Count Over Time** chart
2. Check the **Most Active Clients** metric
3. Examine suspicious requests with [API Traffic](/en/analytic/api-traffic)
**Possible Solutions:**
* Add rate limiting and throttling policies
* Apply IP blacklist/whitelist
* Activate DDoS protection
## Use Cases
### Scenario 1: Daily Operational Monitoring
**Purpose:** Check API health daily.
* General metrics: Success rate, total request count
* Were there any issues overnight?
* Is error rate at normal levels?
* Are there new error types?
* Are response times normal?
* Are there slowdowns?
* Unexpected traffic increases
* New error spikes
**Recommended Settings:**
* Time Range: Last 24 Hours
* Automatic Refresh: 5 Minutes
### Scenario 2: Weekly Performance Analysis
**Purpose:** Weekly trend analysis and capacity planning.
* Did traffic increase / decrease?
* Which days are busier?
* Did response times change?
* How is backend performance?
* Which APIs are used most?
* Is optimization needed?
* Is current capacity sufficient?
* Is scaling necessary?
**Recommended Settings:**
* Time Range: Last 7 Days
* Comparison: With previous week
### Scenario 3: Post-Incident Analysis
**Purpose:** Root cause analysis after a problem occurs.
* Select custom time range (incident time)
* Can spike or anomaly be seen?
* Which APIs were affected?
* What was the error type?
* Backend problem?
* Policy error?
* Traffic increase?
* Examine problematic requests with [Tracing](/en/analytic/tracing)
* At which step did the error occur?
**Recommended Settings:**
* Time Range: Custom (incident time ±1 hour)
* Focus: Error metrics and affected endpoints
## Best Practices
* Daily operational checks
* Weekly trend analyses
* Monthly capacity planning evaluation
* Record normal performance metrics
* Monitor deviations from baseline
* Set alarm thresholds
* Automatic refresh for real-time monitoring
* Appropriate refresh interval selection (1-5 minutes)
* Consider Elasticsearch load
* Separate monitoring for each environment
* Prioritize Production monitoring
* Compare between environments
* Know success rate thresholds
* Set response time expectations
* Quickly detect abnormal situations
* Detect problems from Dashboard
* Examine in detail with [API Traffic](/en/analytic/api-traffic)
* Find root cause with [Tracing](/en/analytic/tracing)
## Limitations and Considerations
**Elasticsearch Connector Required:**
* An Elasticsearch Connector must be added to the environment for dashboard metrics to be displayed
* If there are multiple Elasticsearch Connectors, data from the first added connector is displayed
**Data Freshness Time:**
* Metrics are created from data in Elasticsearch
* It may take a few seconds for log records to reach Elasticsearch
* Shows near real-time data, not real-time
**Performance Tips:**
* Very long time ranges (>30 days) may affect query performance
* Unnecessary frequent refresh increases Elasticsearch load
* You can get faster results by filtering
## Related Resources
Detailed traffic analysis of all API Proxies
Detailed trace and debug operations
Advanced query and filter definitions
Customized analytics reports
Log record configurations
Analytics architecture and components
Querying and analytical visualization of API Traffic in Apinizer Management Console is only possible by adding an [Elasticsearch Connector](/en/integrations/connection-management/elasticsearch-monitor) to the relevant environment.
Since an API Proxy can be loaded into multiple [Environments](/en/concepts/core-concepts/what-is-environment), metrics are **queried based on environment**. Environment selection must be made from the top of the page.
## Features
You can view the general status of API Proxies, total request count, success/error rates
You can analyze response times, processing times, and backend performance metrics
You can monitor API traffic over time, detect peak periods
You can monitor error rates, error types, and problematic endpoints
You can track metrics live by activating the page's automatic refresh feature
You can view separate metrics for different environments
Metrics on the screen can be automatically refreshed using the **Automatic Refresh** option at the top of the page.
## Dashboard Metrics
The dashboard includes the following main metric categories:
### General Metrics
| Metric | Description |
| ---------------------------- | ---------------------------------------------------------------- |
| **Total Request Count** | Total number of API requests received in the selected time range |
| **Successful Request Count** | Requests returning with HTTP 2xx status code |
| **Failed Request Count** | Requests returning with HTTP 4xx and 5xx status code |
| **Success Rate** | Ratio of successful requests to total requests (%) |
| **Error Rate** | Ratio of failed requests to total requests (%) |
| **Average Response Time** | Average response time of all requests (ms) |
### Traffic Metrics
* Change in request count over time (line chart)
* Detection of peak periods
* Trend analysis
* Which API Proxies are used how much
* Usage intensity comparison
* Most used APIs
* Most called endpoints
* Endpoint usage statistics
* Call count ranking
* Usage rates of GET, POST, PUT, DELETE methods
* Request counts by method
### Performance Metrics
* Average response time of all requests
* Change in response time over time
* Performance trend analysis
* Response times in different time ranges
* P50, P95, P99 percentile values
* Min/Max response times
* Response times of backend APIs
* Backend connection times
* Upstream performance metrics
* Endpoints with highest response times
* APIs requiring optimization
### Error Metrics
* 2xx, 4xx, 5xx status code rates
* Success/Error distribution (pie chart)
* Authentication errors
* Routing errors
* Policy errors
* Backend errors
* API Proxies with high error rates
* Problematic endpoints
* Change in error rate over time
* Detection of error spikes
### Client Metrics
* Clients sending most requests
* Request counts by client
* Analysis by Client IP/Key
* Success/error rates by client
* Blocked/Throttled clients
## Automatic Refresh
The dashboard enables live tracking of metrics with the automatic refresh feature.
Select the refresh interval from the **Automatic Refresh** dropdown menu at the top of the page
* 10 seconds
* 30 seconds
* 1 minute
* 5 minutes
Metrics on the screen are automatically refreshed at the selected interval
When automatic refresh is active, metrics continue to update at regular intervals until the page is changed.
Very short refresh intervals (10-30 seconds) can create additional load on Elasticsearch. Intervals of 1-5 minutes are recommended for production environments.
## Environment-Based Querying
Dashboard metrics are queried based on environment. Separate metrics are displayed for each environment.
### Environment Selection
Open the environment selector dropdown at the top of the page
Select the environment you want to see metrics for (Development, Test, Production, etc.)
Metrics for the selected environment are automatically loaded and displayed
Different environments may be connected to different Elasticsearch connectors. If multiple Elasticsearch Connectors are defined, data from the **first** Elasticsearch Connector added in Apinizer Management Console is displayed.
### Time Range Filtering
You can select a time range for metrics:
| Time Range | Description |
| ------------------- | ------------------------------- |
| **Last 15 Minutes** | Ideal for real-time monitoring |
| **Last 1 Hour** | Short-term performance analysis |
| **Last 24 Hours** | Daily traffic analysis |
| **Last 7 Days** | Weekly trend analysis |
| **Last 30 Days** | Monthly usage statistics |
| **Custom Range** | Start and end date selection |
Short time ranges (15 minutes - 1 hour) are suitable for real-time monitoring, while long time ranges (7-30 days) are suitable for trend analysis and capacity planning.
## Metric Interpretation and Usage
You can monitor the health of your APIs by correctly interpreting dashboard metrics.
### Success Rate Interpretation
| Success Rate | Status | Recommended Actions |
| ------------ | --------- | ---------------------------------------------------------- |
| **> 99%** | Very Good | Continue normal monitoring |
| **95-99%** | Good | Monitor errors, make minor improvements |
| **90-95%** | Attention | Analyze error causes, plan fixes |
| **\< 90%** | Critical | Immediate intervention required, perform detailed analysis |
### Response Time Interpretation
| Average Response Time | Status | Recommended Actions |
| --------------------- | --------- | ------------------------------------------ |
| **\< 100ms** | Excellent | Maintain current performance |
| **100-500ms** | Good | Evaluate optimization opportunities |
| **500ms-2s** | Slow | Perform performance optimization |
| **> 2s** | Critical | Immediate optimization required, use cache |
### Traffic Analysis
**Peak Periods:**
* Which hours have heavy traffic?
* Which days receive more requests?
* Should capacity planning be done?
**Sudden Increases (Spikes):**
* Are there unexpected traffic increases?
* Is there suspicion of DDoS attack?
* Is rate limiting sufficient?
**Trend Changes:**
* Is traffic increasing / decreasing?
* Are there seasonal changes?
* How is the impact of new feature launch?
## Problem Detection and Resolution
You can detect and resolve common problems with the dashboard.
### High Error Rate
**Problem Detection:**
* Error rate above 5%
* High 4xx/5xx rate in Status Code Distribution
* Concentrated errors on specific endpoints
**Analysis Steps:**
1. Check the **APIs with Most Errors** metric
2. Filter failed requests from the [API Traffic](/en/analytic/api-traffic) page
3. Perform detailed error analysis with [Tracing](/en/analytic/tracing)
**Possible Solutions:**
* Backend API issues → Inform backend team
* Authentication errors → Check credentials
* Validation errors → Fix request format
### Slow Performance
**Problem Detection:**
* Average response time increased
* Problematic APIs in Slowest Endpoints list
* Low backend performance
**Analysis Steps:**
1. Review the **Slowest Endpoints** metric
2. Analyze policy performance with [Tracing](/en/analytic/tracing)
3. Check backend response times
**Possible Solutions:**
* Add cache policy
* Optimize database queries
* Adjust backend timeout values
* Optimize or remove slow policies
### Abnormal Traffic Increase
**Problem Detection:**
* Sudden and unexpected request increase
* Heavy requests from specific IPs
* Rate limit violations
**Analysis Steps:**
1. Detect spikes in the **Request Count Over Time** chart
2. Check the **Most Active Clients** metric
3. Examine suspicious requests with [API Traffic](/en/analytic/api-traffic)
**Possible Solutions:**
* Add rate limiting and throttling policies
* Apply IP blacklist/whitelist
* Activate DDoS protection
## Use Cases
### Scenario 1: Daily Operational Monitoring
**Purpose:** Check API health daily.
* General metrics: Success rate, total request count
* Were there any issues overnight?
* Is error rate at normal levels?
* Are there new error types?
* Are response times normal?
* Are there slowdowns?
* Unexpected traffic increases
* New error spikes
**Recommended Settings:**
* Time Range: Last 24 Hours
* Automatic Refresh: 5 Minutes
### Scenario 2: Weekly Performance Analysis
**Purpose:** Weekly trend analysis and capacity planning.
* Did traffic increase / decrease?
* Which days are busier?
* Did response times change?
* How is backend performance?
* Which APIs are used most?
* Is optimization needed?
* Is current capacity sufficient?
* Is scaling necessary?
**Recommended Settings:**
* Time Range: Last 7 Days
* Comparison: With previous week
### Scenario 3: Post-Incident Analysis
**Purpose:** Root cause analysis after a problem occurs.
* Select custom time range (incident time)
* Can spike or anomaly be seen?
* Which APIs were affected?
* What was the error type?
* Backend problem?
* Policy error?
* Traffic increase?
* Examine problematic requests with [Tracing](/en/analytic/tracing)
* At which step did the error occur?
**Recommended Settings:**
* Time Range: Custom (incident time ±1 hour)
* Focus: Error metrics and affected endpoints
## Best Practices
* Daily operational checks
* Weekly trend analyses
* Monthly capacity planning evaluation
* Record normal performance metrics
* Monitor deviations from baseline
* Set alarm thresholds
* Automatic refresh for real-time monitoring
* Appropriate refresh interval selection (1-5 minutes)
* Consider Elasticsearch load
* Separate monitoring for each environment
* Prioritize Production monitoring
* Compare between environments
* Know success rate thresholds
* Set response time expectations
* Quickly detect abnormal situations
* Detect problems from Dashboard
* Examine in detail with [API Traffic](/en/analytic/api-traffic)
* Find root cause with [Tracing](/en/analytic/tracing)
## Limitations and Considerations
**Elasticsearch Connector Required:**
* An Elasticsearch Connector must be added to the environment for dashboard metrics to be displayed
* If there are multiple Elasticsearch Connectors, data from the first added connector is displayed
**Data Freshness Time:**
* Metrics are created from data in Elasticsearch
* It may take a few seconds for log records to reach Elasticsearch
* Shows near real-time data, not real-time
**Performance Tips:**
* Very long time ranges (>30 days) may affect query performance
* Unnecessary frequent refresh increases Elasticsearch load
* You can get faster results by filtering
## Related Resources
Detailed traffic analysis of all API Proxies
Detailed trace and debug operations
Advanced query and filter definitions
Customized analytics reports
Log record configurations
Analytics architecture and components