> ## Documentation Index
> Fetch the complete documentation index at: https://docs.apinizer.com/llms.txt
> Use this file to discover all available pages before exploring further.
# Trace
> You can track step by step how requests coming to API Proxies are processed. You can start trace, monitor policy-based execution, perform request/response inspection, and perform performance analysis. You can view detailed log records for debug and error detection.
Tracing enables you to monitor and analyze your API Proxy message processing flow in real-time. Trace operations are performed **on an API Proxy basis** and are activated separately for each API Proxy.
This module is particularly used for:
* Understanding how policies work
* Detecting performance issues
* Debugging
* Examining request/response flow
* Validating transformations
You can start a separate trace session for each API Proxy
You can track each policy's execution step by step and view log records
You can analyze timing metrics and detect bottlenecks
You can easily detect errors and perform root cause analysis
Trace runs per API Proxy. Clicking a log row opens the trace detail drawer on the right, with timing breakdown, the Client–Gateway–API map, and before/after policy panels. For the full walkthrough, see [Step-by-Step Tracing](/en/develop/monitoring-analysis/step-by-step-tracing).
## Starting Trace Mode
Trace mode is started separately for each API Proxy. You can activate trace mode from the API Proxy's own page.
### Prerequisites
Before starting trace mode:
The API Proxy you want to track must be loaded into at least one [Environment](/en/concepts/core-concepts/what-is-environment)
Go to the detail page of the API Proxy you want to trace
Select the Environment for which trace mode will be opened from the Environments where the API Proxy is loaded
Activate trace mode by clicking the **Start** button
 With **Custom Query** from the filter field next to environment selection, you can specifically trace only desired data.
When trace mode is activated:
* Log record content is expanded to allow detailed examination
* Log records are written to MongoDB configuration database
* Detailed log records are created for all executed policies
* This continues to be stored until the mode is stopped or automatically closed by the platform after **5 minutes**
## Trace Records
After trace mode is activated, requests coming to the API Proxy are automatically tracked and detailed records are created.
With **Custom Query** from the filter field next to environment selection, you can specifically trace only desired data.
When trace mode is activated:
* Log record content is expanded to allow detailed examination
* Log records are written to MongoDB configuration database
* Detailed log records are created for all executed policies
* This continues to be stored until the mode is stopped or automatically closed by the platform after **5 minutes**
## Trace Records
After trace mode is activated, requests coming to the API Proxy are automatically tracked and detailed records are created.
 Log records being displayed are not automatically updated. Use the **Refresh Logs** button to see new records.
Each log record shown in the table belongs to the request coming from the client to this API Proxy and the response message given to that request.
Since the log record of API Call Policy is kept separately, double logs appear for the same request. The first is the before and after state of the message in the main flow, and the second is the request and response message coming out of the API Call.
### Trace List
The following information is displayed for each record in the trace list:
| Information | Description |
| ------------------- | ------------------------------------------ |
| **Timestamp** | Date and time when the request arrived |
| **Method** | HTTP method (GET, POST, PUT, DELETE, etc.) |
| **Path / Endpoint** | Request path and endpoint name |
| **Status Code** | Response status code (200, 404, 500, etc.) |
| **Duration** | Total processing time (ms) |
| **Policies** | Number of policies executed |
| **Correlation ID** | Request-specific correlation ID |
When API Call Policy is used, double log records appear for the same request:
1. Before and after state of the message in the main flow
2. Request and response message coming out of the API Call
### Trace Operations
The following operations can be performed for each trace record:
The first control at the end of the row for the request message to be examined opens a window that displays the log records of that message.
Log records being displayed are not automatically updated. Use the **Refresh Logs** button to see new records.
Each log record shown in the table belongs to the request coming from the client to this API Proxy and the response message given to that request.
Since the log record of API Call Policy is kept separately, double logs appear for the same request. The first is the before and after state of the message in the main flow, and the second is the request and response message coming out of the API Call.
### Trace List
The following information is displayed for each record in the trace list:
| Information | Description |
| ------------------- | ------------------------------------------ |
| **Timestamp** | Date and time when the request arrived |
| **Method** | HTTP method (GET, POST, PUT, DELETE, etc.) |
| **Path / Endpoint** | Request path and endpoint name |
| **Status Code** | Response status code (200, 404, 500, etc.) |
| **Duration** | Total processing time (ms) |
| **Policies** | Number of policies executed |
| **Correlation ID** | Request-specific correlation ID |
When API Call Policy is used, double log records appear for the same request:
1. Before and after state of the message in the main flow
2. Request and response message coming out of the API Call
### Trace Operations
The following operations can be performed for each trace record:
The first control at the end of the row for the request message to be examined opens a window that displays the log records of that message.
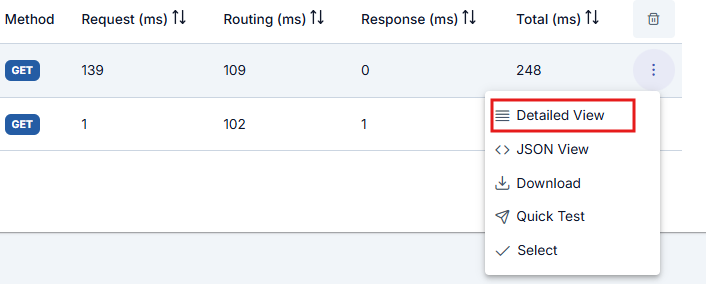 In the opened window, logs are divided into sections related to message flow. When the name of the section to be examined is clicked, log records related to that area are displayed. By default, the **Overview** section is open.
 The button next to the Detailed View button displays log records in JSON format.
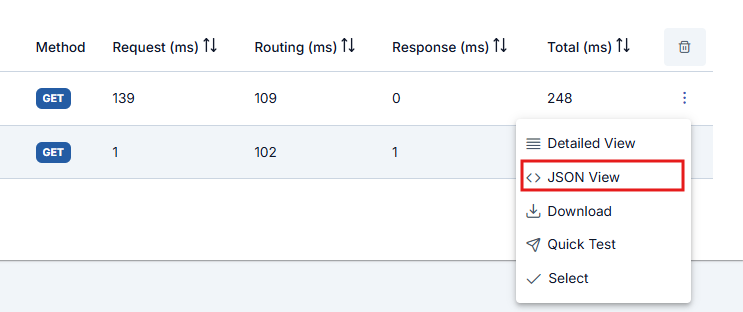
 Key values in JSON view are written in readable format. For example:
* The "apiProxyId" value is stored as "api" in the log record
* For actual log format, you can refer to the [API Traffic Log Record Data Structure](/en/analytic/api-traffic-log-record-data-structure) page
When Apinizer is in step-by-step tracking mode, it also creates detailed log records for all policies executed for the API Proxy. The download option provides the ability to download all log records created on a request basis collectively.
Key values in JSON view are written in readable format. For example:
* The "apiProxyId" value is stored as "api" in the log record
* For actual log format, you can refer to the [API Traffic Log Record Data Structure](/en/analytic/api-traffic-log-record-data-structure) page
When Apinizer is in step-by-step tracking mode, it also creates detailed log records for all policies executed for the API Proxy. The download option provides the ability to download all log records created on a request basis collectively.
 If the data size of the log record is greater than 500KB, the **Show Details** and **View in JSON Format** options are disabled. In this case, the record must be downloaded for examination.
The Quick Test button on the relevant row opens the [Test Console](/en/develop/test-debug-tools/test-console) formatted so that the sent request can be immediately retested and sent.
If the data size of the log record is greater than 500KB, the **Show Details** and **View in JSON Format** options are disabled. In this case, the record must be downloaded for examination.
The Quick Test button on the relevant row opens the [Test Console](/en/develop/test-debug-tools/test-console) formatted so that the sent request can be immediately retested and sent.
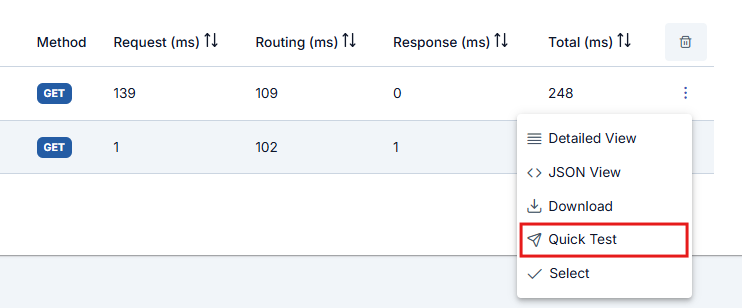 The Quick Test button must be enabled in general settings to appear.
## Tracking Policy Flow
Click the **Select** button to view the detailed execution information Apinizer keeps for policies run on the API Proxy while step-by-step tracing is on.
The Quick Test button must be enabled in general settings to appear.
## Tracking Policy Flow
Click the **Select** button to view the detailed execution information Apinizer keeps for policies run on the API Proxy while step-by-step tracing is on.
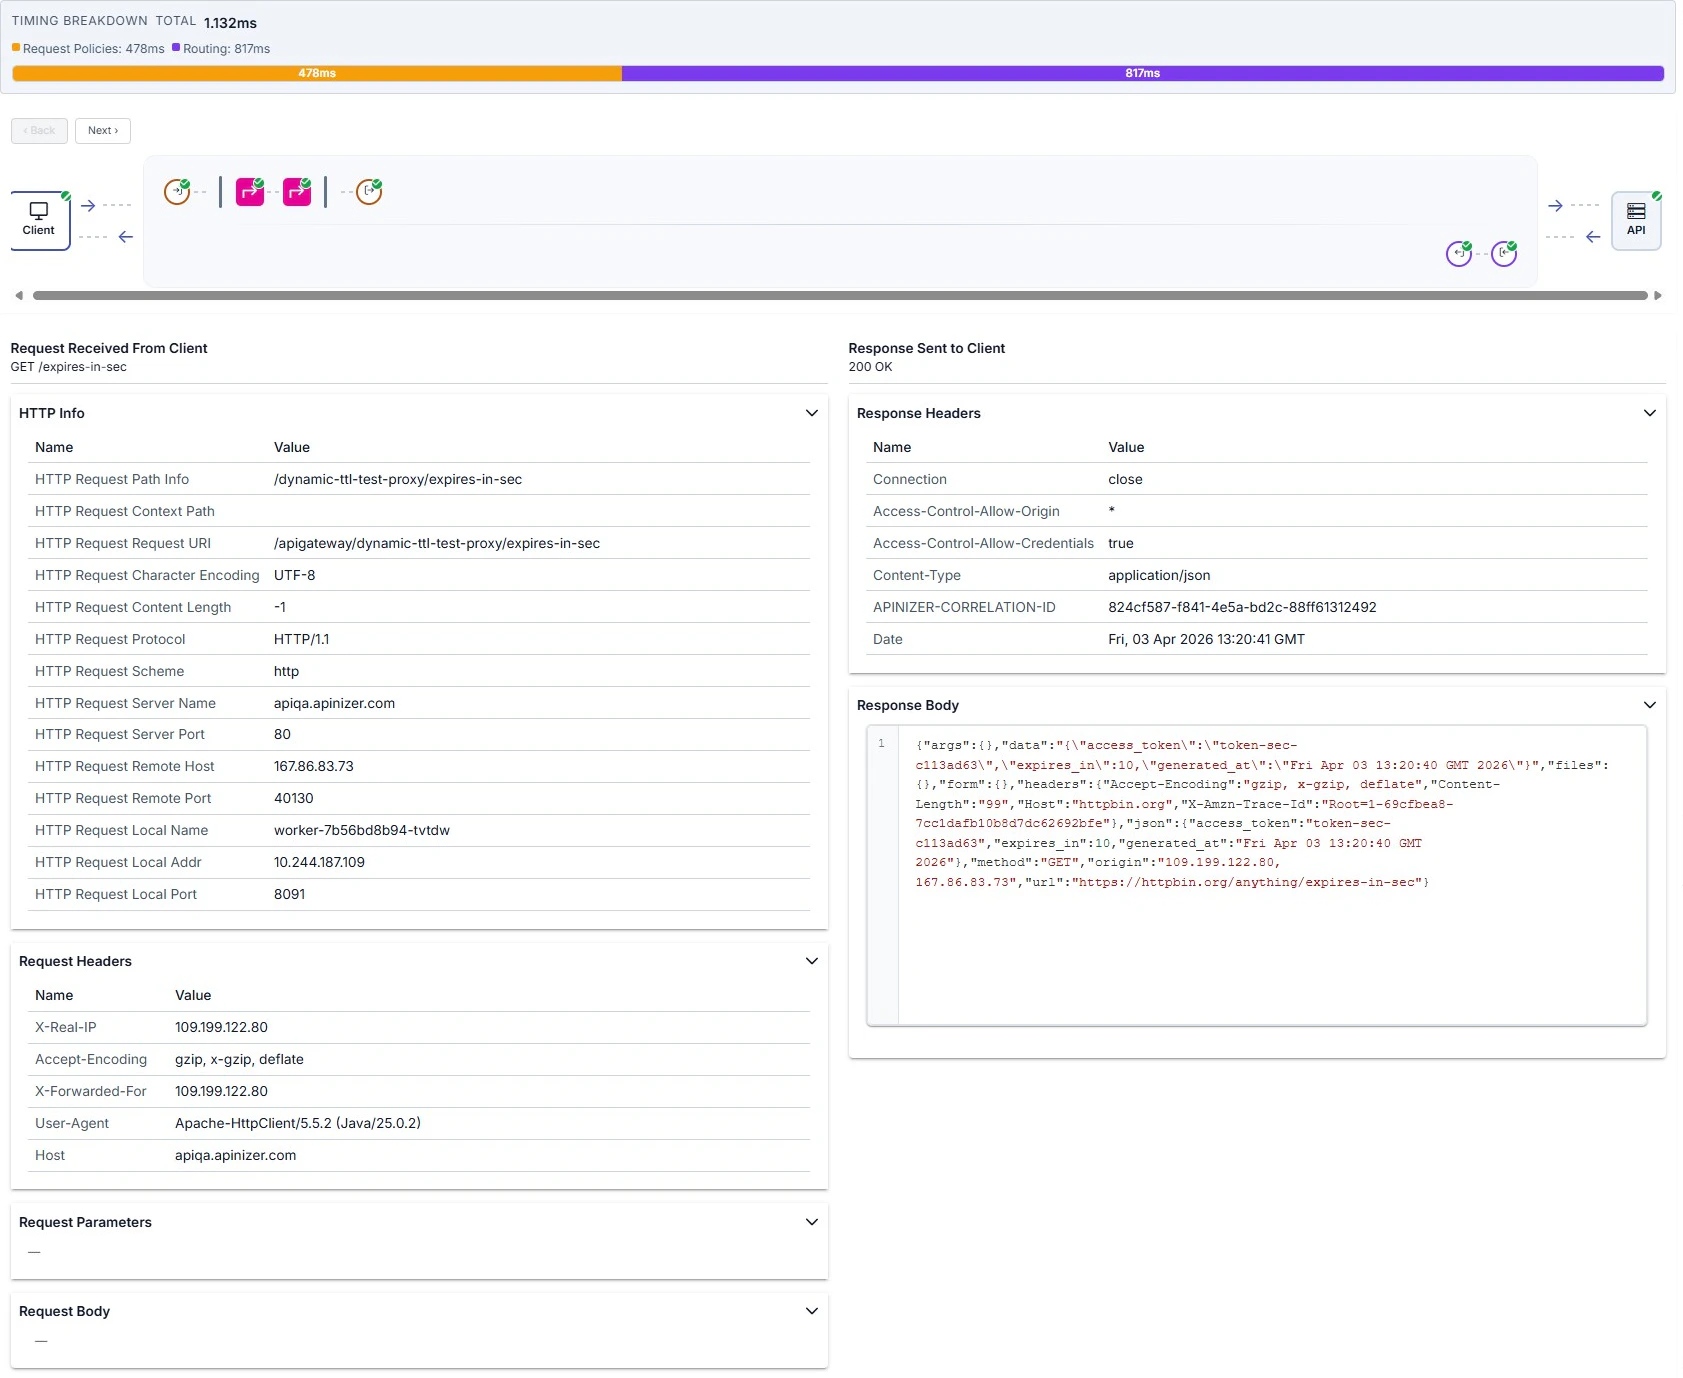
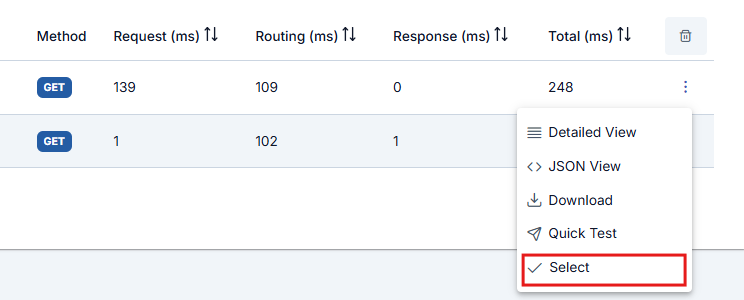 When you click a table row or **Select** in the row menu, the **trace detail drawer** opens on the right. At the top you see **timing breakdown** and the **Client → Gateway → API** map; request-line (top row) and response-line (bottom row) policy nodes show execution order, including policies from an [API Proxy Group](/en/concepts/core-concepts/api-proxy-group) when applicable.
Nodes show a green check for success, **!** for error or block, and a faded appearance with an **S** badge for skipped policies. Use **‹ Back** / **Next ›** or click a node to move between steps. For the full walkthrough, see [Step-by-Step Tracing](/en/develop/monitoring-analysis/step-by-step-tracing).
Example when all steps succeed: timing bar, map, and **Client** step with request/response panels.
When you click a table row or **Select** in the row menu, the **trace detail drawer** opens on the right. At the top you see **timing breakdown** and the **Client → Gateway → API** map; request-line (top row) and response-line (bottom row) policy nodes show execution order, including policies from an [API Proxy Group](/en/concepts/core-concepts/api-proxy-group) when applicable.
Nodes show a green check for success, **!** for error or block, and a faded appearance with an **S** badge for skipped policies. Use **‹ Back** / **Next ›** or click a node to move between steps. For the full walkthrough, see [Step-by-Step Tracing](/en/develop/monitoring-analysis/step-by-step-tracing).
Example when all steps succeed: timing bar, map, and **Client** step with request/response panels.
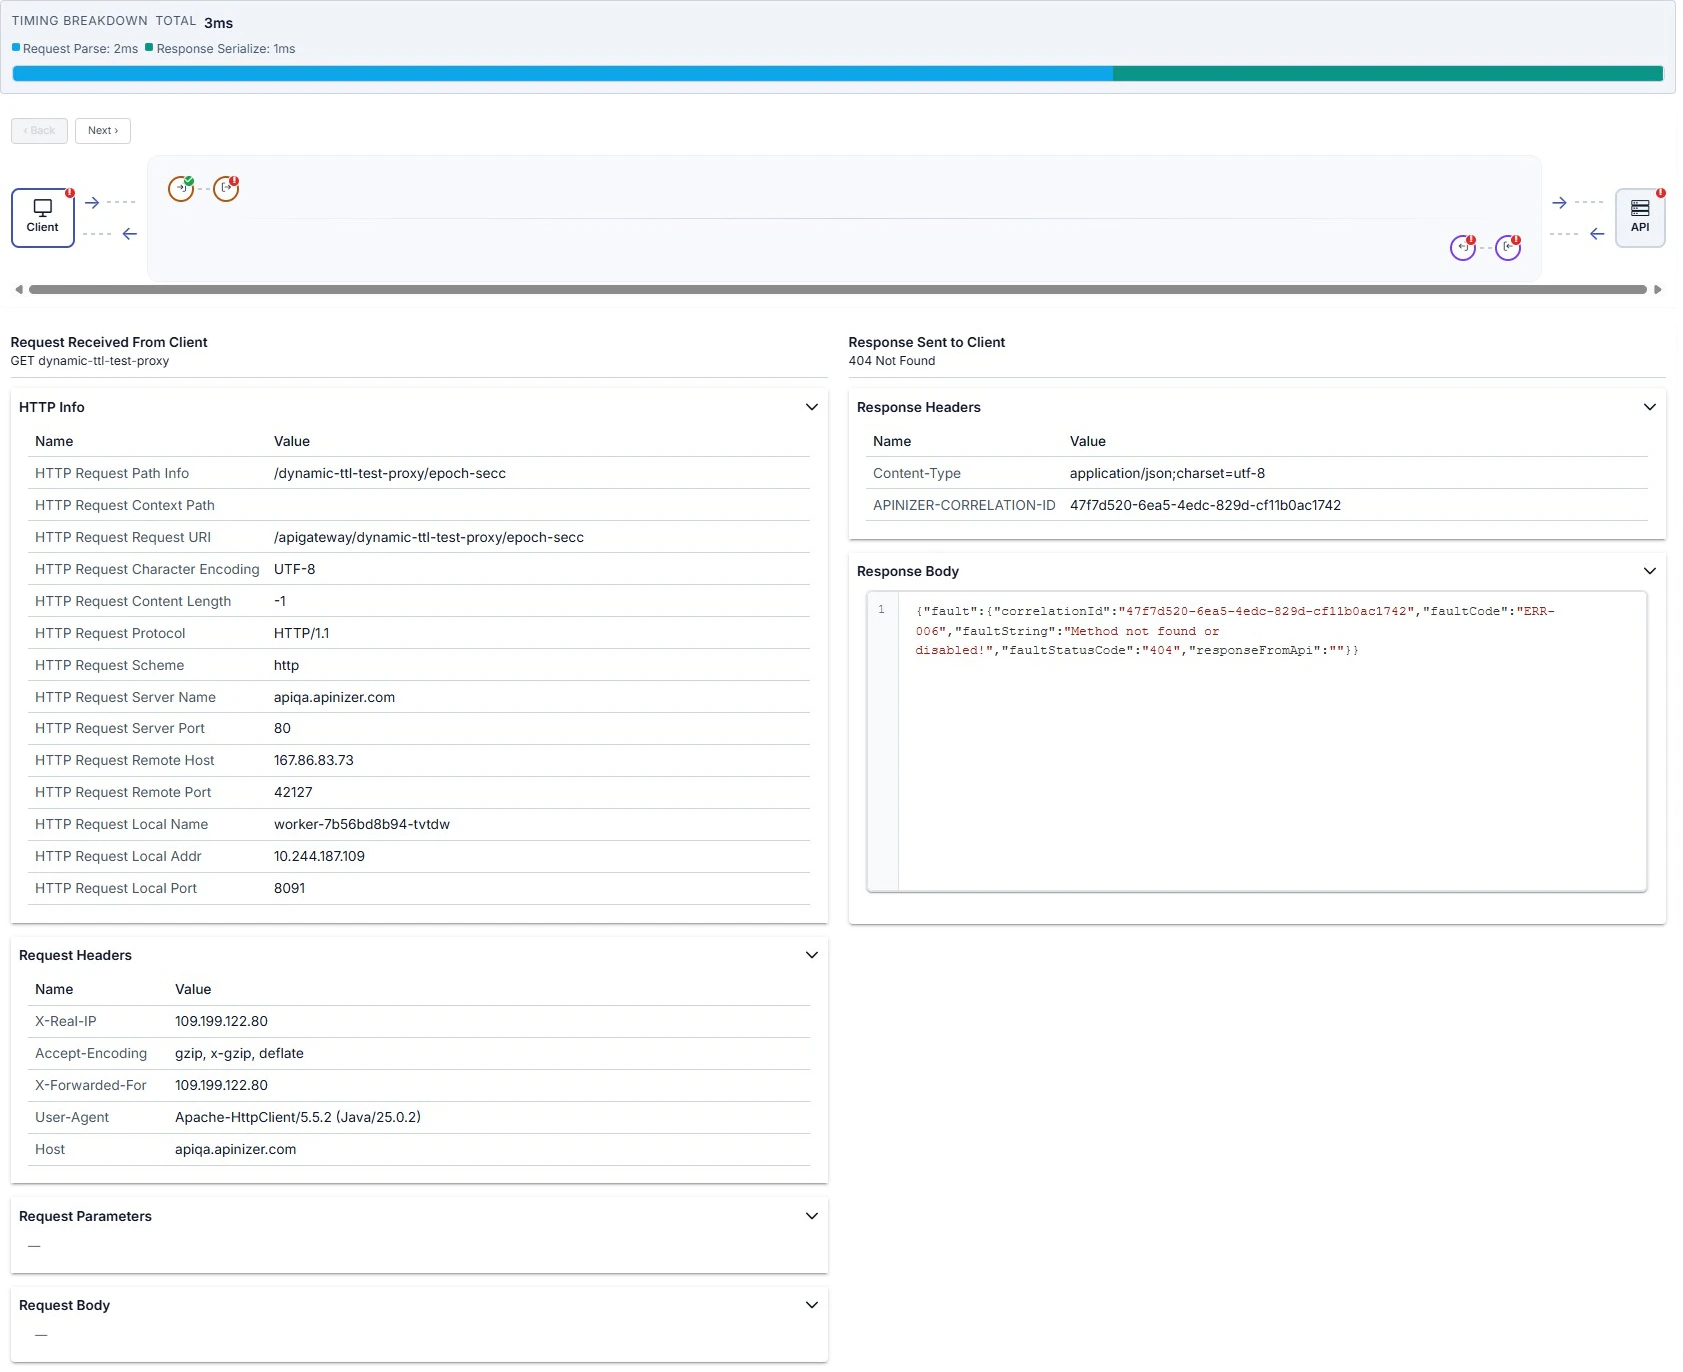
 On errors (for example policy rejection, routing, or backend **404**), related nodes on the map may show a red **!**; on the **Client** step you can read the HTTP status and details such as a JSON `fault` body in the response to the client.
Steps expected after the failure may be missing on the map or appear unexecuted; an error response is returned to the client.
On errors (for example policy rejection, routing, or backend **404**), related nodes on the map may show a red **!**; on the **Client** step you can read the HTTP status and details such as a JSON `fault` body in the response to the client.
Steps expected after the failure may be missing on the map or appear unexecuted; an error response is returned to the client.
 ### Policy Execution Details
Policies executed first when a request arrives:
* **Policy Name**: Name of the executed policy
* **Execution Time**: Policy execution time (ms)
* **Status**: Success / Failure status
* **Changes**: Changes made by the policy to the message (header, body, variable changes)
Examples: Authentication, rate limiting, IP control
Routing step to Backend API:
* **Selected Upstream**: Selected [upstream target](/en/concepts/core-concepts/routing-and-upstream)
* **Load Balancing Decision**: Load balancing algorithm decision
* **Connection Time**: Connection time to backend (ms)
* **Backend Response Time**: Backend response time (ms)
* **Retry/Failover**: Retry or failover status
Policies executed after response comes from backend:
* **Policy Name**: Name of the executed policy
* **Execution Time**: Policy execution time (ms)
* **Status**: Success / Failure status
* **Changes**: Changes made to the response message
Examples: Response transformation, cache writing, logging
Policies executed in case of error:
* **Error Type**: Error type (authentication, routing, policy, etc.)
* **Error Message**: Error message
* **Handler Policies**: Executed error handler policies
* **Final Response**: Final response returned to client
Fault Handler only runs when an error occurs and allows you to customize the error response.
#### Policy-Specific Execution Details
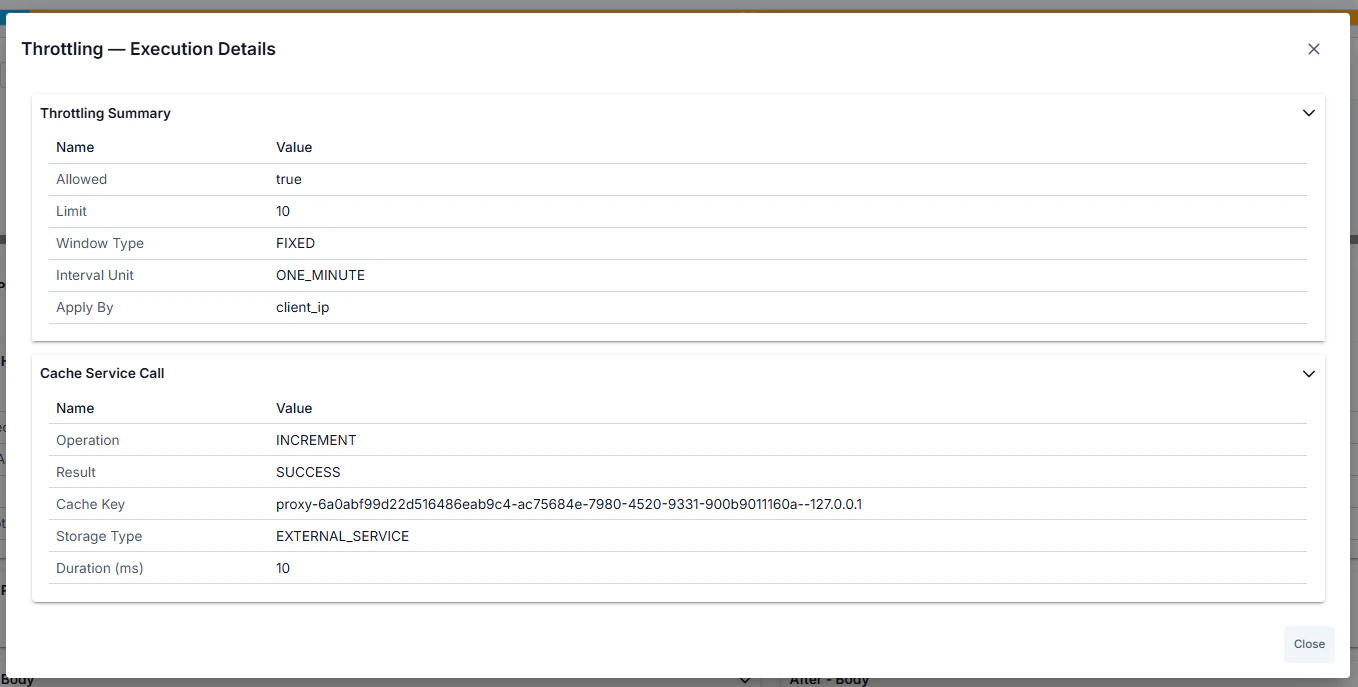
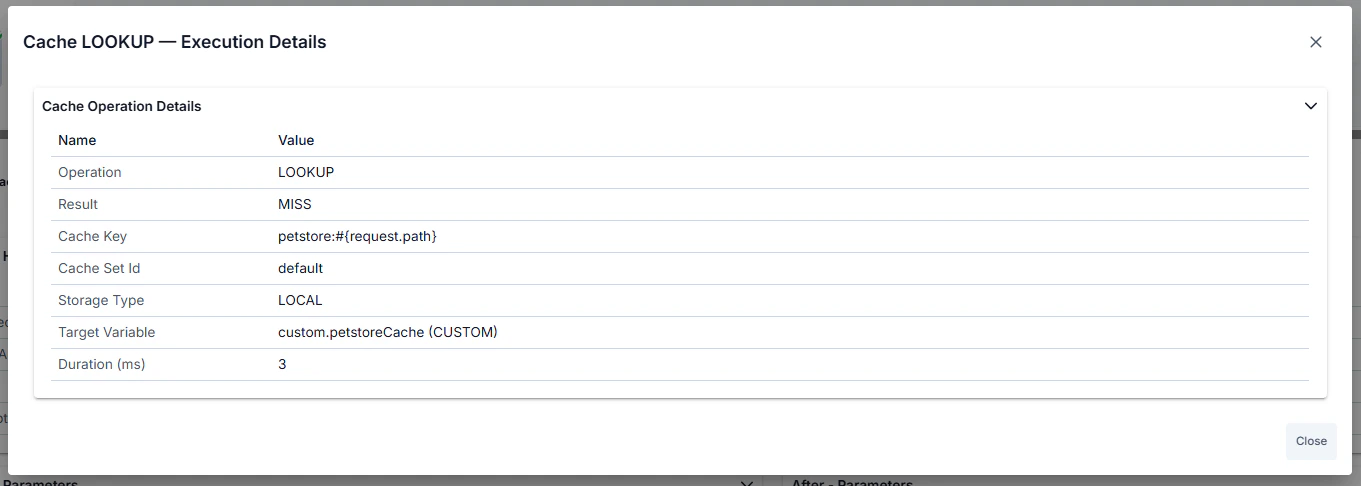
Certain policy types display an **"Execution Details"** button in the policy panel header bar. Clicking the button opens a modal with policy-type-specific domain information presented in accordion sections. This detailed view is available on both request-side (pre-flow, request) and response-side (response, post-flow) policy nodes in the trace detail drawer.
### Policy Execution Details
Policies executed first when a request arrives:
* **Policy Name**: Name of the executed policy
* **Execution Time**: Policy execution time (ms)
* **Status**: Success / Failure status
* **Changes**: Changes made by the policy to the message (header, body, variable changes)
Examples: Authentication, rate limiting, IP control
Routing step to Backend API:
* **Selected Upstream**: Selected [upstream target](/en/concepts/core-concepts/routing-and-upstream)
* **Load Balancing Decision**: Load balancing algorithm decision
* **Connection Time**: Connection time to backend (ms)
* **Backend Response Time**: Backend response time (ms)
* **Retry/Failover**: Retry or failover status
Policies executed after response comes from backend:
* **Policy Name**: Name of the executed policy
* **Execution Time**: Policy execution time (ms)
* **Status**: Success / Failure status
* **Changes**: Changes made to the response message
Examples: Response transformation, cache writing, logging
Policies executed in case of error:
* **Error Type**: Error type (authentication, routing, policy, etc.)
* **Error Message**: Error message
* **Handler Policies**: Executed error handler policies
* **Final Response**: Final response returned to client
Fault Handler only runs when an error occurs and allows you to customize the error response.
#### Policy-Specific Execution Details
Certain policy types display an **"Execution Details"** button in the policy panel header bar. Clicking the button opens a modal with policy-type-specific domain information presented in accordion sections. This detailed view is available on both request-side (pre-flow, request) and response-side (response, post-flow) policy nodes in the trace detail drawer.
 **Policy types with Execution Details:**
1. **Cache Policy** — Operation (LOOKUP/POPULATE/INVALIDATE), cache key, cache set name, hit/miss status (for LOOKUP), source/target variable names, TTL applied, time remaining in cache.
2. **API Call Policy** — Cache status (HIT/MISS/DISABLED), backend service URL, HTTP method and status code, request/response headers, full request/response body, connection time, backend response time, retry/failover details.
3. **Backend API Authentication Policy** — Authentication result (authenticated true/false), extracted username or principal, assigned roles, extracted claims or attributes, HTTP authentication call details (URL, method, headers).
4. **JOSE Validation / Implementation Dynamic Key Fetch Policy** — Key cache lookup status (hit/miss), validation or implementation mode, key extraction path (JSONPath/XPath), key ID (kid), algorithm used, HTTP call details for remote key fetch (if applicable).
5. **Client Ban Policy** — Ban status (banned/not banned), ban source (IP address or other identifier), remaining ban duration, ban reason, cache lookup details.
6. **API Based Throttling Policy** — Current request count and limit threshold, time window, allowed/blocked decision, cache lookup status (hit/miss), sliding window details.
7. **API Based Quota Policy** — Current quota usage and quota limit, period end time, allowed/blocked decision, cache lookup status (hit/miss), reset time for next period.
8. **Business Rule Policy** — Per-action execution list showing: action type, operator, execution status (executed/skipped/error), condition evaluation result, input and output values, execution duration in milliseconds.
## Detailed Log Records
When you select a log row, the drawer summarizes success or failure via the map and header; the lower panel shows tables and bodies for the selected node. Overview example — map, summary line, and request headers:
**Policy types with Execution Details:**
1. **Cache Policy** — Operation (LOOKUP/POPULATE/INVALIDATE), cache key, cache set name, hit/miss status (for LOOKUP), source/target variable names, TTL applied, time remaining in cache.
2. **API Call Policy** — Cache status (HIT/MISS/DISABLED), backend service URL, HTTP method and status code, request/response headers, full request/response body, connection time, backend response time, retry/failover details.
3. **Backend API Authentication Policy** — Authentication result (authenticated true/false), extracted username or principal, assigned roles, extracted claims or attributes, HTTP authentication call details (URL, method, headers).
4. **JOSE Validation / Implementation Dynamic Key Fetch Policy** — Key cache lookup status (hit/miss), validation or implementation mode, key extraction path (JSONPath/XPath), key ID (kid), algorithm used, HTTP call details for remote key fetch (if applicable).
5. **Client Ban Policy** — Ban status (banned/not banned), ban source (IP address or other identifier), remaining ban duration, ban reason, cache lookup details.
6. **API Based Throttling Policy** — Current request count and limit threshold, time window, allowed/blocked decision, cache lookup status (hit/miss), sliding window details.
7. **API Based Quota Policy** — Current quota usage and quota limit, period end time, allowed/blocked decision, cache lookup status (hit/miss), reset time for next period.
8. **Business Rule Policy** — Per-action execution list showing: action type, operator, execution status (executed/skipped/error), condition evaluation result, input and output values, execution duration in milliseconds.
## Detailed Log Records
When you select a log row, the drawer summarizes success or failure via the map and header; the lower panel shows tables and bodies for the selected node. Overview example — map, summary line, and request headers:
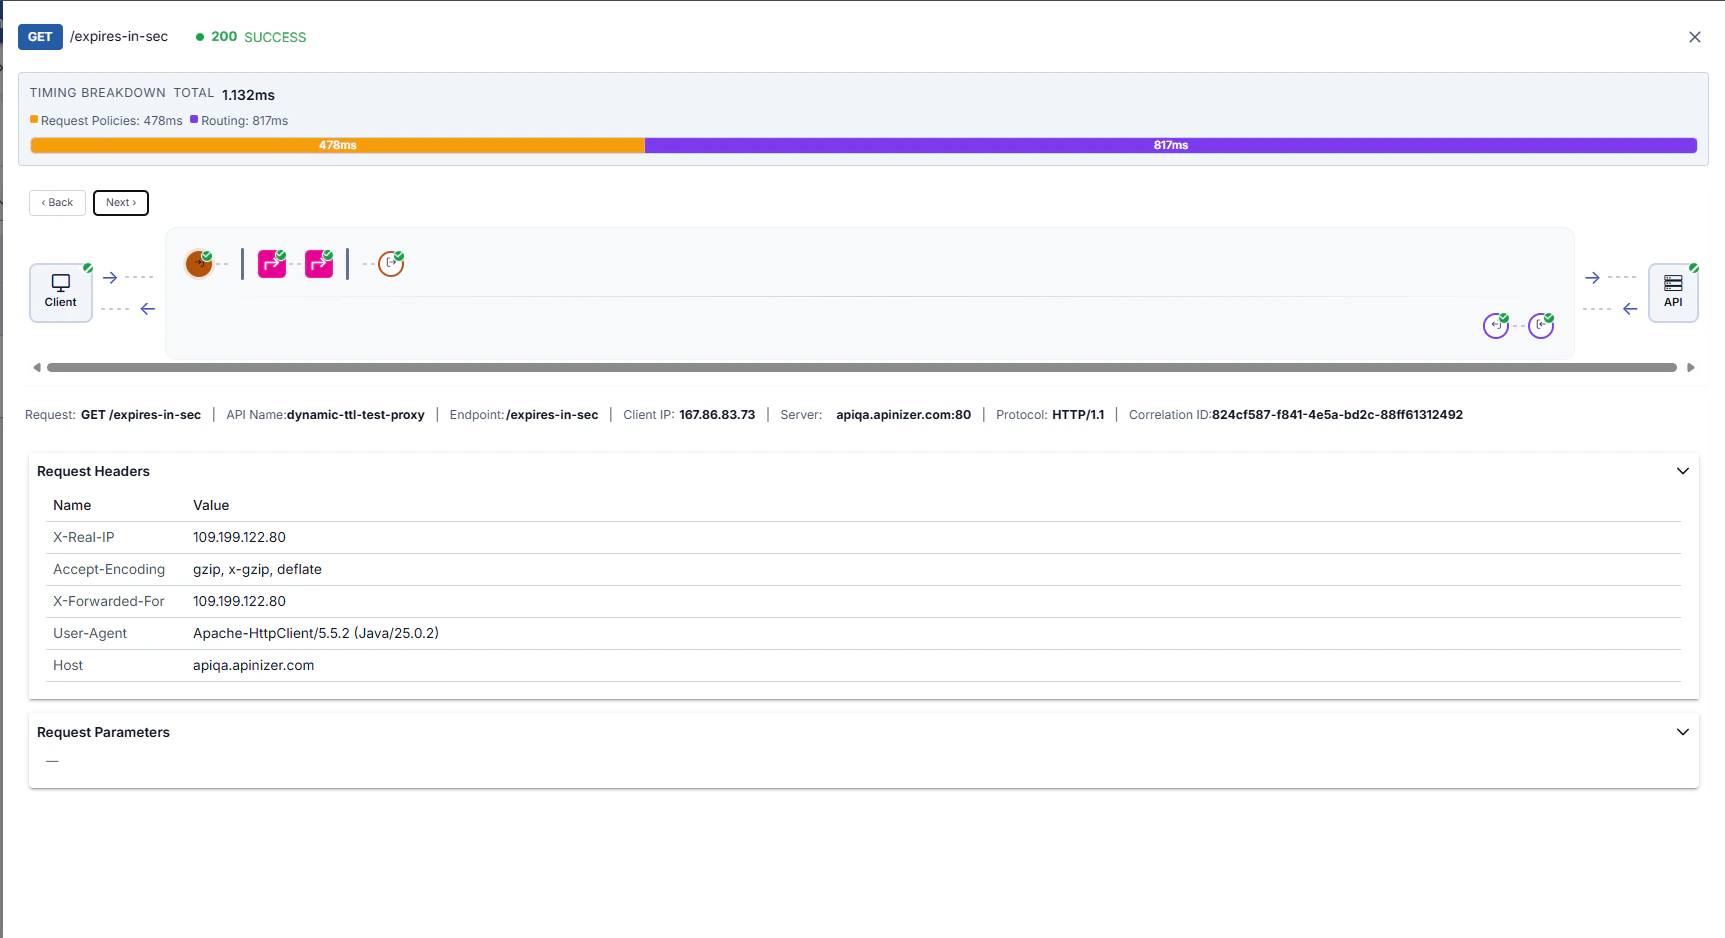 Below, common steps in the same drawer are summarized with the recommended screenshots (full walkthrough on [Step-by-Step Tracing](/en/develop/monitoring-analysis/step-by-step-tracing)).
When the **Client** node is selected on the map, the left column shows the request from the client (**HTTP Info**, headers, parameters, body) and the right column shows the response sent to the client.
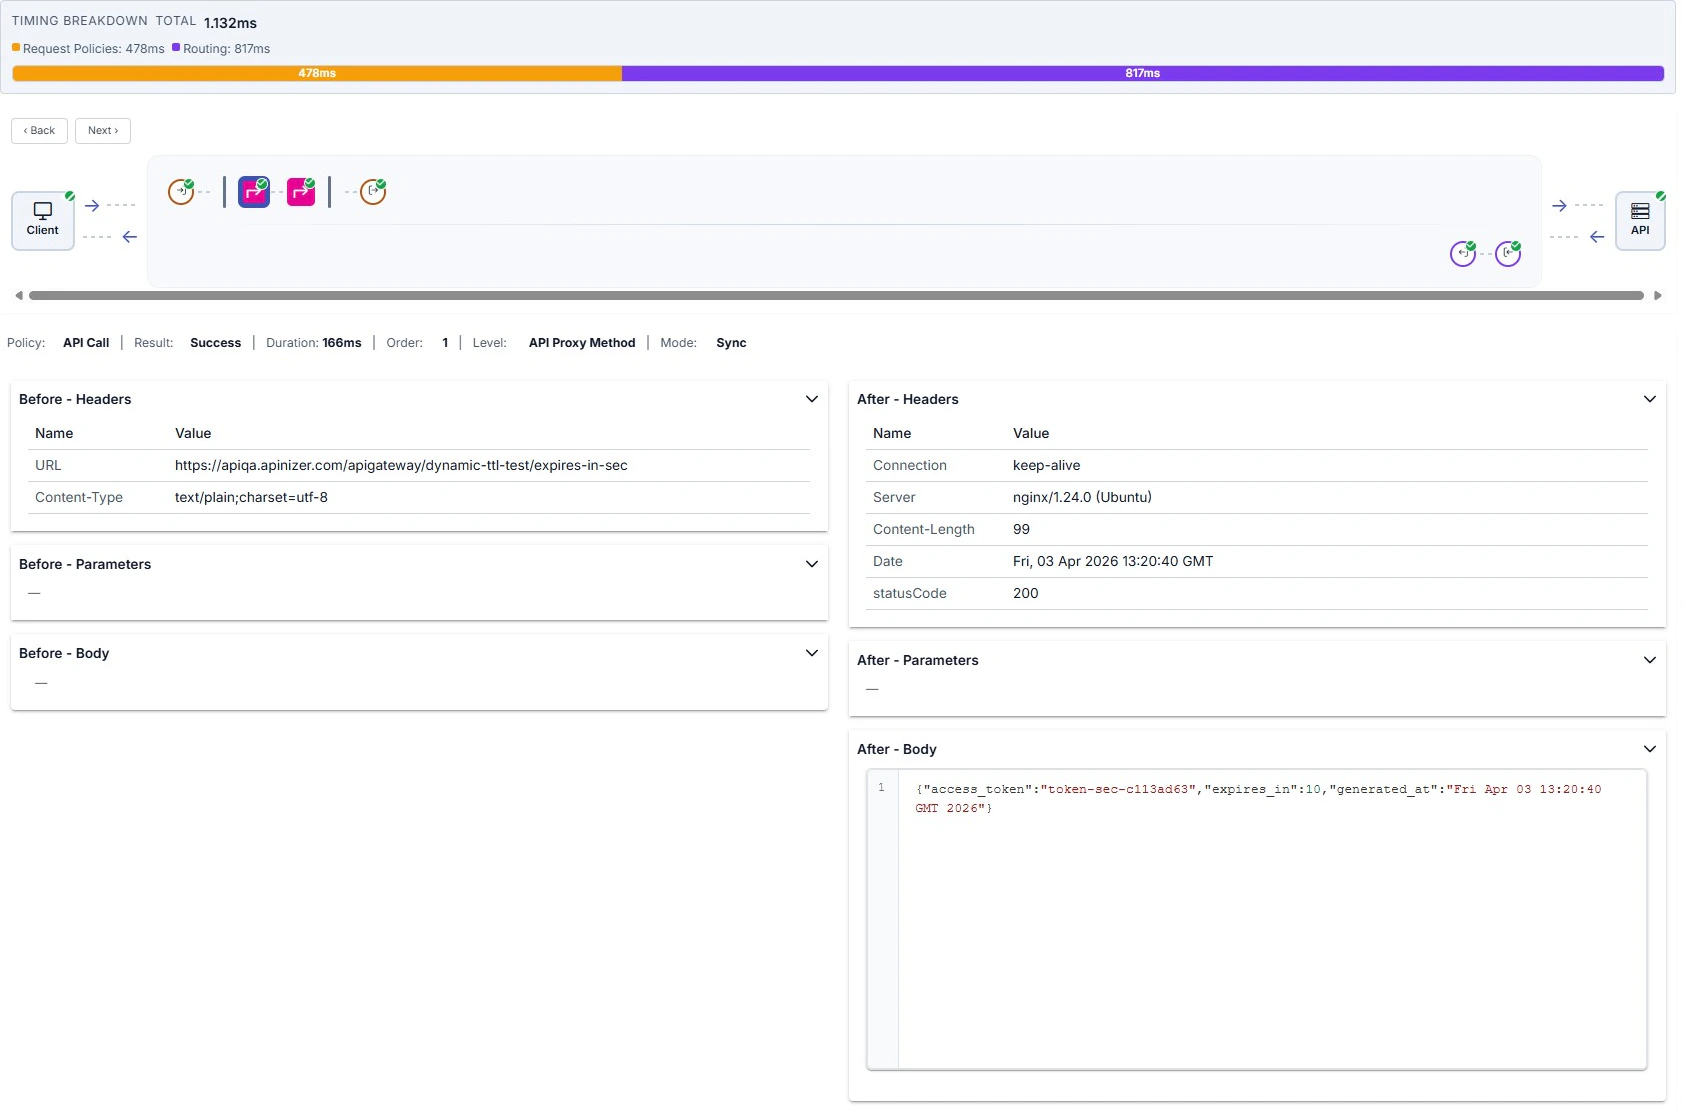
Click a policy node on the map to see execution info and **Before** / **After** accordions comparing message state.
Below, common steps in the same drawer are summarized with the recommended screenshots (full walkthrough on [Step-by-Step Tracing](/en/develop/monitoring-analysis/step-by-step-tracing)).
When the **Client** node is selected on the map, the left column shows the request from the client (**HTTP Info**, headers, parameters, body) and the right column shows the response sent to the client.
Click a policy node on the map to see execution info and **Before** / **After** accordions comparing message state.
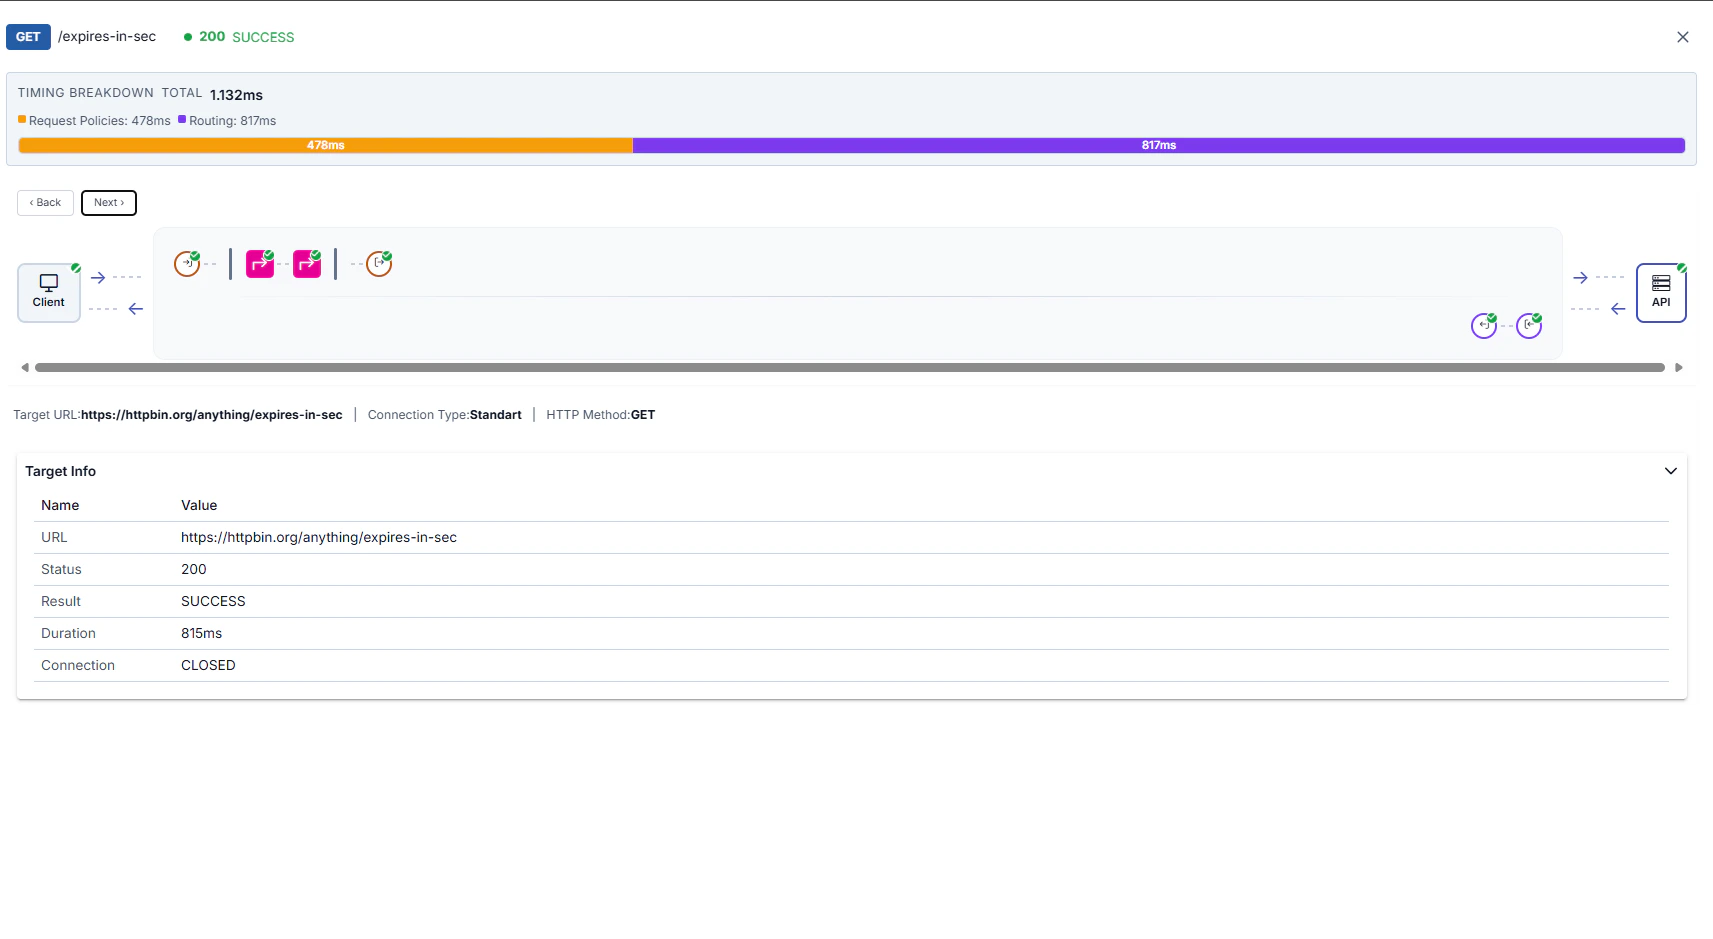
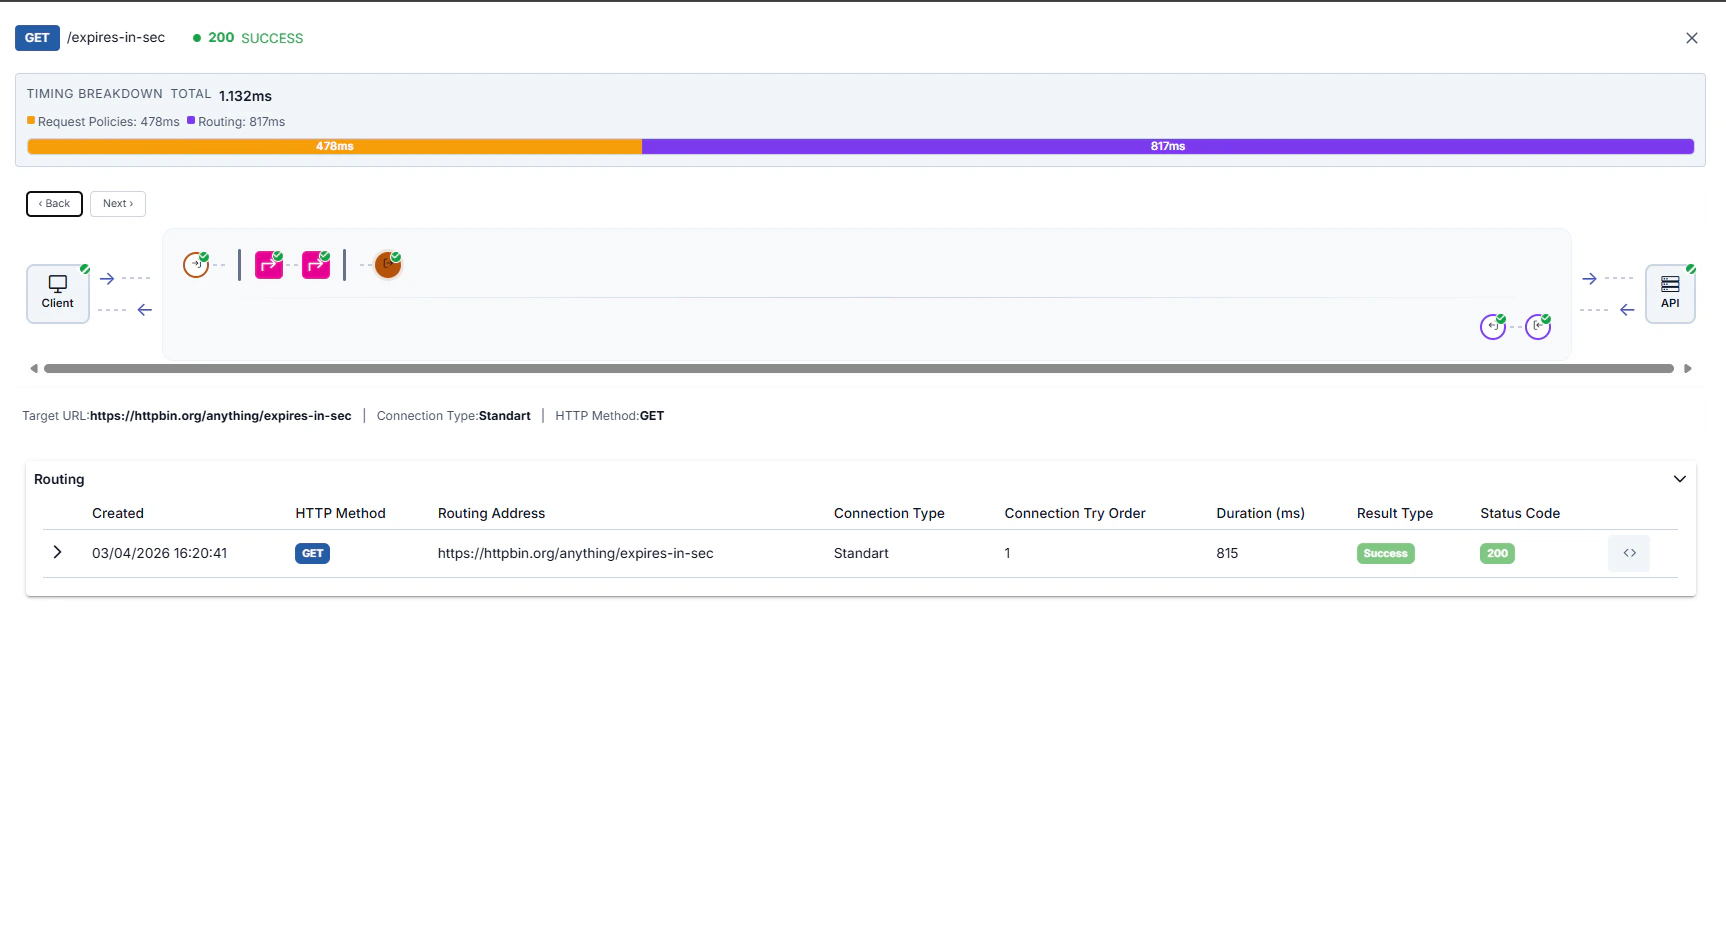
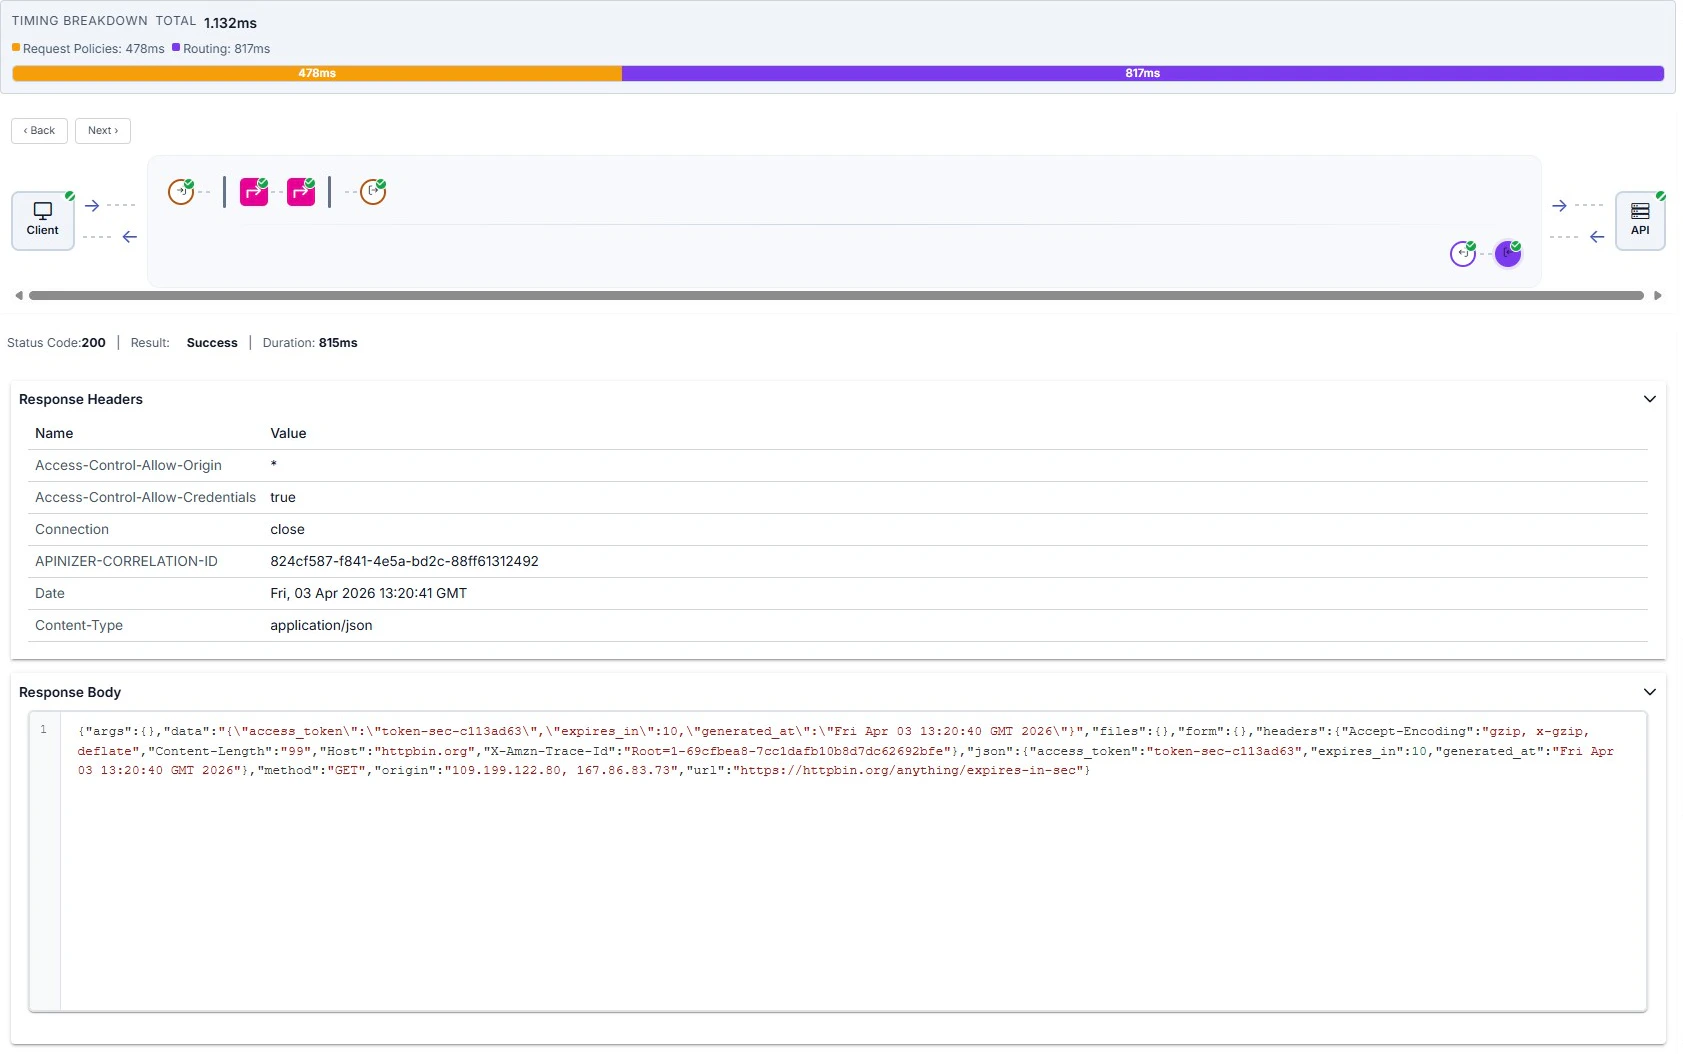
 **Target (API)** summary, **Routing** table (expanded row; see [HTTP Routing](/en/develop/routing/http-routing)), and **response from target** are illustrated below in order.
 ### Request/Response Comparison
Trace mode shows how the message changes along the flow:
You can compare the before and after state of the message for each policy
You can see the effect of transformation policies
You can see added, modified, or deleted headers
You can see JSON/XML transformations and content changes
## Performance Analysis
Trace mode provides detailed timing metrics to detect performance issues.
### Timing Metrics
The following metrics are displayed for each trace record:
| Metric | Description |
| ---------------------- | ------------------------------------------------- |
| **Total Duration** | Total entry-exit time of the request (ms) |
| **Pre-flow Duration** | Total execution time of pre-flow policies |
| **Route Duration** | Connection to backend and response receiving time |
| **Backend Duration** | Backend API response time (net) |
| **Post-flow Duration** | Total execution time of post-flow policies |
| **Gateway Overhead** | Time added by Apinizer Gateway (Total - Backend) |
If **Gateway Overhead** is high, policy optimization can be done. If **Backend Duration** is high, backend API should be optimized.
### Policy Performance Analysis
To analyze policy performance:
You can identify and optimize policies taking the longest time
You can see the total number of policies executed, remove unnecessary policies
You can monitor the average execution time of each policy
You can improve performance by changing the order of policies
**Optimization Recommendations:**
* **Cache Policy**: Use cache to reduce backend calls
* **Conditional Flow**: Conditionally skip unnecessary policies
* **Script Optimization**: Optimize slow operations in script policies
* **Transformation**: Remove unnecessary transformations
### Backend Performance Metrics
To monitor backend API performance:
| Metric | Description |
| ------------------------ | ---------------------------------------- |
| **Connection Time** | TCP connection time to backend server |
| **SSL Handshake Time** | SSL handshake time for HTTPS connection |
| **Response Time** | Backend response generation time |
| **Total Backend Time** | Connection + Response total time |
| **Backend Status** | Success status of backend call |
| **Retry/Failover Count** | Number of retries or failovers performed |
High **Connection Time** indicates that the backend server is slow or has network issues. High **Response Time** indicates that the backend API needs to be optimized.
## Use Cases
### Scenario 1: Performance Issue Detection
**Situation:** Response times of an API Proxy are higher than expected.
Activate trace mode from the API Proxy page
Find slow requests (e.g., >1000ms) in trace records
Open the trace detail drawer (table row or **Select**) and identify the slowest policies
* Is backend API slow? → Backend should be optimized
* Are policies slow? → Script/transformation should be optimized
* Is database query slow? → Cache can be used
Fix detected issues and test again with trace
### Scenario 2: Debugging
**Situation:** Some requests return 500 error and the cause is unknown.
Activate trace mode from the API Proxy page
Find 5xx errors in trace records
Open the trace detail drawer (table row or **Select**) and find the policy marked with **!**
* Examine the message coming to the policy (Before)
* Read the error message
* Examine detailed log records
* Is data format wrong?
* Is header missing?
* Is it a script error?
* Is backend unreachable?
Fix the issue and test again with trace
### Scenario 3: Transformation Validation
**Situation:** Checking if JSON to XML transformation works correctly.
Activate trace mode from the API Proxy page
Send a sample JSON request from Test Console
Open the trace detail drawer (table row or **Select**) and click the transformation policy node
* Before: Incoming JSON message
* After: Converted XML message
* Check if the transformation is correct
Verify in Backend API log records that the outgoing message is in XML format and correct
### Scenario 4: Conditional Flow Testing
**Situation:** Testing if conditional policies work correctly.
Activate trace mode from the API Proxy page
* Request for premium user
* Request for normal user
* Request for guest
Open the trace detail drawer (table row or **Select**) and see which policies ran
* What was the condition expression?
* What was the evaluation result?
* Did the correct policies run?
Fix incorrect conditions and test again with trace
## Best Practices
### Trace Usage
* Trace continuously during development
* Always test with trace when adding new policies
* Validate API changes with trace
* Activate trace in production only when necessary
* Trace automatically closes after 5 minutes
* Consider performance impact
* Filter with Custom Query from the filter field next to environment selection
* Trace only relevant endpoints
* Minimize unnecessary trace records
* Start trace separately for each API Proxy
* Activate trace mode from the relevant API Proxy's page
* Trace records are stored in MongoDB
### Performance Monitoring
**Create Performance Baseline:**
* Measure average response time of API under normal conditions
* Record average execution time of each policy
* Monitor deviations from baseline and set alarms
**Regular Monitoring:**
* Run performance trace once a week
* Perform trend analyses
* Detect slowdowns early
**Optimization Cycle:**
1. Detect bottlenecks with trace
2. Optimize
3. Validate improvement with trace
4. Document results
### Debugging
**Repeatable Test Scenarios:**
* Prepare test scenarios before starting trace
* Get consistent results using the same test data
* Test edge cases
**Systematic Approach:**
1. Isolate the problem (which endpoint, under which condition?)
2. Collect detailed information with trace
3. Perform root cause analysis
4. Fix
5. Validate with trace
6. Document the process
**Before/After Comparison:**
* Compare input/output messages for each policy
* Detect unexpected changes
* Check transformation correctness
## Related Resources
API Proxy-based trace operations
API test and debug console
Managing and configuring policies
Configuring log record settings
Information about message flow and policy execution
Detailed information about conditional flow
### Request/Response Comparison
Trace mode shows how the message changes along the flow:
You can compare the before and after state of the message for each policy
You can see the effect of transformation policies
You can see added, modified, or deleted headers
You can see JSON/XML transformations and content changes
## Performance Analysis
Trace mode provides detailed timing metrics to detect performance issues.
### Timing Metrics
The following metrics are displayed for each trace record:
| Metric | Description |
| ---------------------- | ------------------------------------------------- |
| **Total Duration** | Total entry-exit time of the request (ms) |
| **Pre-flow Duration** | Total execution time of pre-flow policies |
| **Route Duration** | Connection to backend and response receiving time |
| **Backend Duration** | Backend API response time (net) |
| **Post-flow Duration** | Total execution time of post-flow policies |
| **Gateway Overhead** | Time added by Apinizer Gateway (Total - Backend) |
If **Gateway Overhead** is high, policy optimization can be done. If **Backend Duration** is high, backend API should be optimized.
### Policy Performance Analysis
To analyze policy performance:
You can identify and optimize policies taking the longest time
You can see the total number of policies executed, remove unnecessary policies
You can monitor the average execution time of each policy
You can improve performance by changing the order of policies
**Optimization Recommendations:**
* **Cache Policy**: Use cache to reduce backend calls
* **Conditional Flow**: Conditionally skip unnecessary policies
* **Script Optimization**: Optimize slow operations in script policies
* **Transformation**: Remove unnecessary transformations
### Backend Performance Metrics
To monitor backend API performance:
| Metric | Description |
| ------------------------ | ---------------------------------------- |
| **Connection Time** | TCP connection time to backend server |
| **SSL Handshake Time** | SSL handshake time for HTTPS connection |
| **Response Time** | Backend response generation time |
| **Total Backend Time** | Connection + Response total time |
| **Backend Status** | Success status of backend call |
| **Retry/Failover Count** | Number of retries or failovers performed |
High **Connection Time** indicates that the backend server is slow or has network issues. High **Response Time** indicates that the backend API needs to be optimized.
## Use Cases
### Scenario 1: Performance Issue Detection
**Situation:** Response times of an API Proxy are higher than expected.
Activate trace mode from the API Proxy page
Find slow requests (e.g., >1000ms) in trace records
Open the trace detail drawer (table row or **Select**) and identify the slowest policies
* Is backend API slow? → Backend should be optimized
* Are policies slow? → Script/transformation should be optimized
* Is database query slow? → Cache can be used
Fix detected issues and test again with trace
### Scenario 2: Debugging
**Situation:** Some requests return 500 error and the cause is unknown.
Activate trace mode from the API Proxy page
Find 5xx errors in trace records
Open the trace detail drawer (table row or **Select**) and find the policy marked with **!**
* Examine the message coming to the policy (Before)
* Read the error message
* Examine detailed log records
* Is data format wrong?
* Is header missing?
* Is it a script error?
* Is backend unreachable?
Fix the issue and test again with trace
### Scenario 3: Transformation Validation
**Situation:** Checking if JSON to XML transformation works correctly.
Activate trace mode from the API Proxy page
Send a sample JSON request from Test Console
Open the trace detail drawer (table row or **Select**) and click the transformation policy node
* Before: Incoming JSON message
* After: Converted XML message
* Check if the transformation is correct
Verify in Backend API log records that the outgoing message is in XML format and correct
### Scenario 4: Conditional Flow Testing
**Situation:** Testing if conditional policies work correctly.
Activate trace mode from the API Proxy page
* Request for premium user
* Request for normal user
* Request for guest
Open the trace detail drawer (table row or **Select**) and see which policies ran
* What was the condition expression?
* What was the evaluation result?
* Did the correct policies run?
Fix incorrect conditions and test again with trace
## Best Practices
### Trace Usage
* Trace continuously during development
* Always test with trace when adding new policies
* Validate API changes with trace
* Activate trace in production only when necessary
* Trace automatically closes after 5 minutes
* Consider performance impact
* Filter with Custom Query from the filter field next to environment selection
* Trace only relevant endpoints
* Minimize unnecessary trace records
* Start trace separately for each API Proxy
* Activate trace mode from the relevant API Proxy's page
* Trace records are stored in MongoDB
### Performance Monitoring
**Create Performance Baseline:**
* Measure average response time of API under normal conditions
* Record average execution time of each policy
* Monitor deviations from baseline and set alarms
**Regular Monitoring:**
* Run performance trace once a week
* Perform trend analyses
* Detect slowdowns early
**Optimization Cycle:**
1. Detect bottlenecks with trace
2. Optimize
3. Validate improvement with trace
4. Document results
### Debugging
**Repeatable Test Scenarios:**
* Prepare test scenarios before starting trace
* Get consistent results using the same test data
* Test edge cases
**Systematic Approach:**
1. Isolate the problem (which endpoint, under which condition?)
2. Collect detailed information with trace
3. Perform root cause analysis
4. Fix
5. Validate with trace
6. Document the process
**Before/After Comparison:**
* Compare input/output messages for each policy
* Detect unexpected changes
* Check transformation correctness
## Related Resources
API Proxy-based trace operations
API test and debug console
Managing and configuring policies
Configuring log record settings
Information about message flow and policy execution
Detailed information about conditional flow