> ## Documentation Index
> Fetch the complete documentation index at: https://docs.apinizer.com/llms.txt
> Use this file to discover all available pages before exploring further.
# Benchmark Results
> Explore independent load test results measuring Apinizer Gateway's maximum request capacity, CPU scaling efficiency, and Elasticsearch traffic logging overhead across different resource configurations.
These results reflect a **zero-policy** scenario: only request routing and asynchronous traffic logging were measured. In production environments, actual throughput will be lower depending on the type and number of active policies. CPU-intensive policies (XSLT, XSD validation, encryption) reduce throughput, while policies requiring external system calls (LDAP, OAuth2 introspection) increase response latency. See the [Policy Performance Impact](#policy-performance-impact) section for details.
## Test Environment
The benchmark was run across four isolated servers. Each component was deployed on a separate machine to prevent measurements from interfering with each other.
* 6 vCPU · 12 GB RAM · 100 GB NVMe
* **wrk2** load generation tool
* CentOS, single server
* 6 vCPU · 12 GB RAM · 100 GB NVMe
* High-capacity Go-based HTTP server (\~70K RPS)
* Network RTT to load generator: **\~0.5 ms**
* 8 vCPU · 24 GB RAM · 200 GB NVMe
* Elasticsearch 8 — traffic log target
* Physically separate from the gateway server
* 12 vCPU (Intel Broadwell @ 2.0 GHz) · 48 GB RAM · 250 GB NVMe
* Runs on Kubernetes
* Hosts Worker pods only
API Manager, MongoDB, and the Kubernetes master run on a separate server. These components have no direct impact on gateway performance; they only serve configuration data during the load test.
### Gateway Resource Configurations (Tiers)
The gateway was tested under four different resource constraints on Kubernetes. Each tier represents a real-world production deployment scenario.
| Tier | CPU | Memory | IO Threads | Worker Threads | VT Parallelism |
| ------ | :-: | :----: | :--------: | :------------: | :------------: |
| **W1** | 1 | 2 GB | 2 | 256 | 1 |
| **W2** | 2 | 2 GB | 4 | 512 | 2 |
| **W4** | 4 | 4 GB | 8 | 1,024 | 4 |
| **W8** | 8 | 8 GB | 16 | 3,072 | 8 |
The JVM engine is **G1GC** across all tiers. Heap size, Direct Memory, and GC region size are automatically determined by the entrypoint per tier (W1/W2: Heap 60%, W4/W8: Heap 65%). Backend I/O and traffic logging run on **Virtual Threads (VT)**; HTTP dispatch uses **Platform Threads (PT)**.
***
## Methodology
### Load Generator: wrk2
Tests were conducted with **wrk2**, a high-precision HTTP load generator designed to track actual request rates and eliminate coordinated omission bias.
**Core parameter — R=999999 Overload Method:**
```bash theme={null}
wrk2 -t -c -d300s -R999999 --latency
```
The `R=999999` target rate is set far above the gateway's maximum sustainable RPS. This means the measured value is the system's **true maximum throughput**, not a pre-configured rate.
### Test Parameters
| Parameter | Value |
| --------------- | -------------------------------- |
| Request types | GET · POST 1KB · POST 5KB |
| Duration | 300 seconds |
| Repetitions | 3 runs per concurrency point |
| Reported value | Average of 3 runs |
| Latency metrics | P50 · P99 |
| ES modes | ES Off · ES On |
| Policy | None (zero-policy, pure routing) |
### Upstream Is Not a Bottleneck
The upstream server can sustain approximately 4–5× the gateway's maximum throughput (\~70,000 RPS). All observed limits originate from gateway capacity; the upstream is not a bottleneck.
Network latency between the load generator and the gateway was measured at **\~0.5 ms**.
### ES Modes
* **ES Off**: Traffic logs are not written to Elasticsearch. Measures pure gateway overhead.
* **ES On**: An asynchronous traffic log is written to Elasticsearch for each request. Simulates a real production scenario.
***
## Results
### 1. Peak Throughput Summary
Maximum RPS observed across all concurrency points for each tier and request type.
#### ES Off
| Tier | CPU | GET (RPS) | POST 1KB (RPS) | POST 5KB (RPS) |
| ---- | :-: | ---------: | -------------: | -------------: |
| W1 | 1 | **1,638** | 1,480 | 1,352 |
| W2 | 2 | **3,842** | 3,322 | 3,097 |
| W4 | 4 | **9,078** | 8,019 | 6,573 |
| W8 | 8 | **15,692** | 12,992 | 6,431 |
#### ES On
| Tier | CPU | GET (RPS) | POST 1KB (RPS) | POST 5KB (RPS) |
| ---- | :-: | ---------: | -------------: | -------------: |
| W1 | 1 | **1,422** | 1,342 | 1,148 |
| W2 | 2 | **3,385** | 2,498 | 2,237 |
| W4 | 4 | **7,490** | 5,980 | 5,147 |
| W8 | 8 | **14,256** | 12,704 | 6,543 |
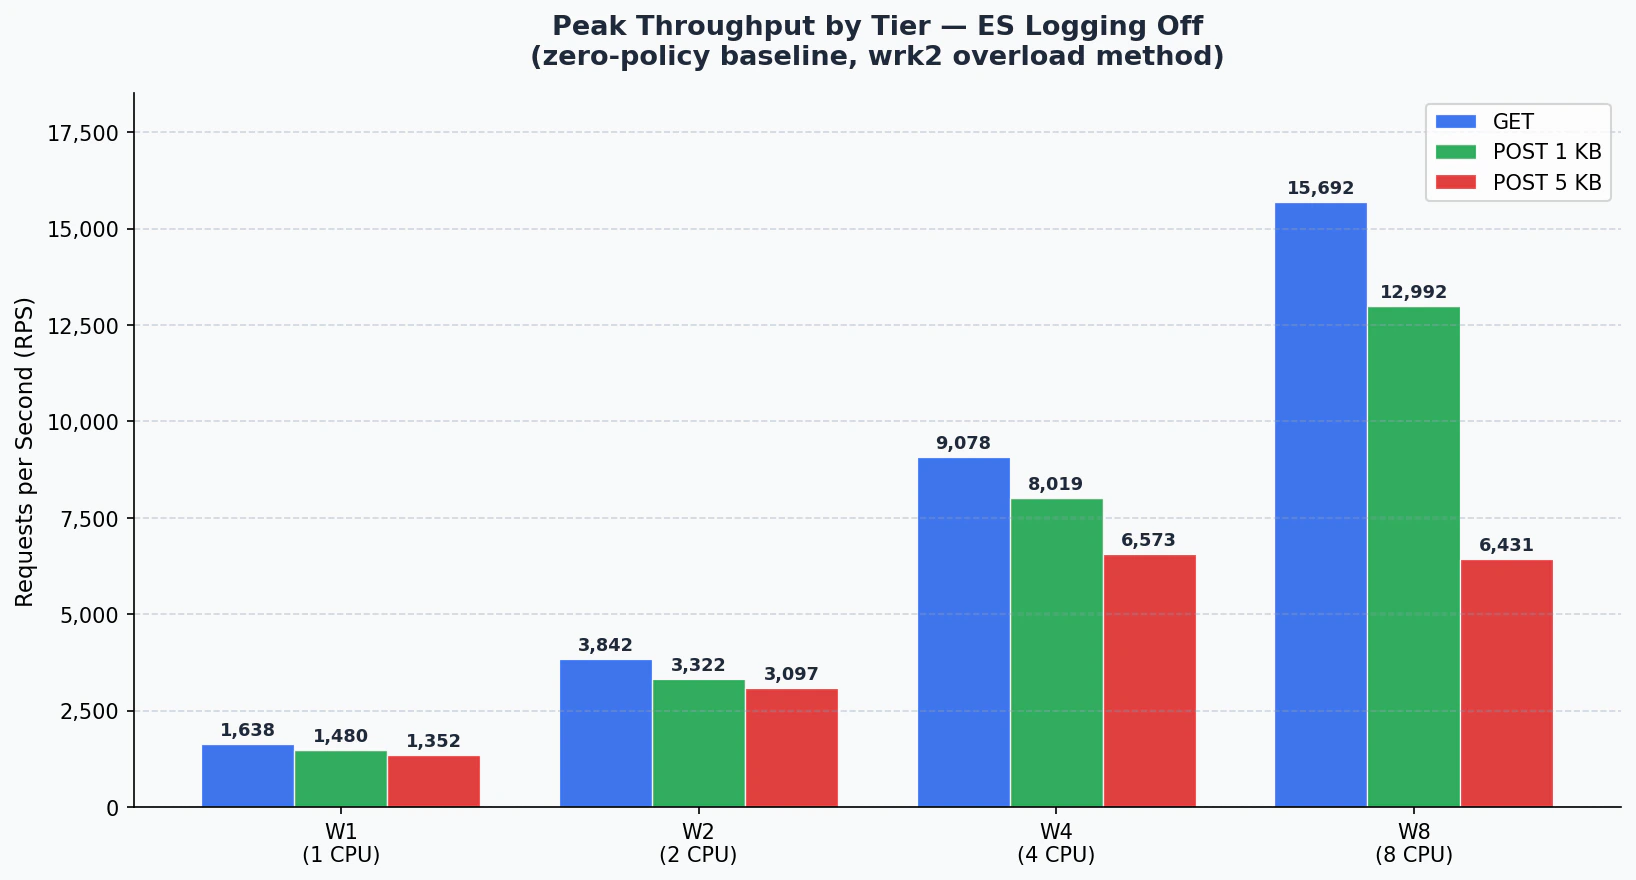 At the W8 tier, the ES On/Off difference is significantly smaller than at lower tiers. The async processing capacity provided by 8 CPUs largely absorbs Elasticsearch write latency.
***
### 2. CPU Scaling Efficiency
RPS per CPU core and scaling ratio relative to W1 (ES Off, GET).
| Tier | CPU | Peak RPS | RPS/CPU | Scaling |
| ---- | :-: | -------: | ------: | --------: |
| W1 | 1 | 1,638 | 1,638 | 1.00× |
| W2 | 2 | 3,842 | 1,921 | **1.17×** |
| W4 | 4 | 9,078 | 2,269 | **1.38×** |
| W8 | 8 | 15,692 | 1,961 | **1.20×** |
At the W8 tier, the ES On/Off difference is significantly smaller than at lower tiers. The async processing capacity provided by 8 CPUs largely absorbs Elasticsearch write latency.
***
### 2. CPU Scaling Efficiency
RPS per CPU core and scaling ratio relative to W1 (ES Off, GET).
| Tier | CPU | Peak RPS | RPS/CPU | Scaling |
| ---- | :-: | -------: | ------: | --------: |
| W1 | 1 | 1,638 | 1,638 | 1.00× |
| W2 | 2 | 3,842 | 1,921 | **1.17×** |
| W4 | 4 | 9,078 | 2,269 | **1.38×** |
| W8 | 8 | 15,692 | 1,961 | **1.20×** |
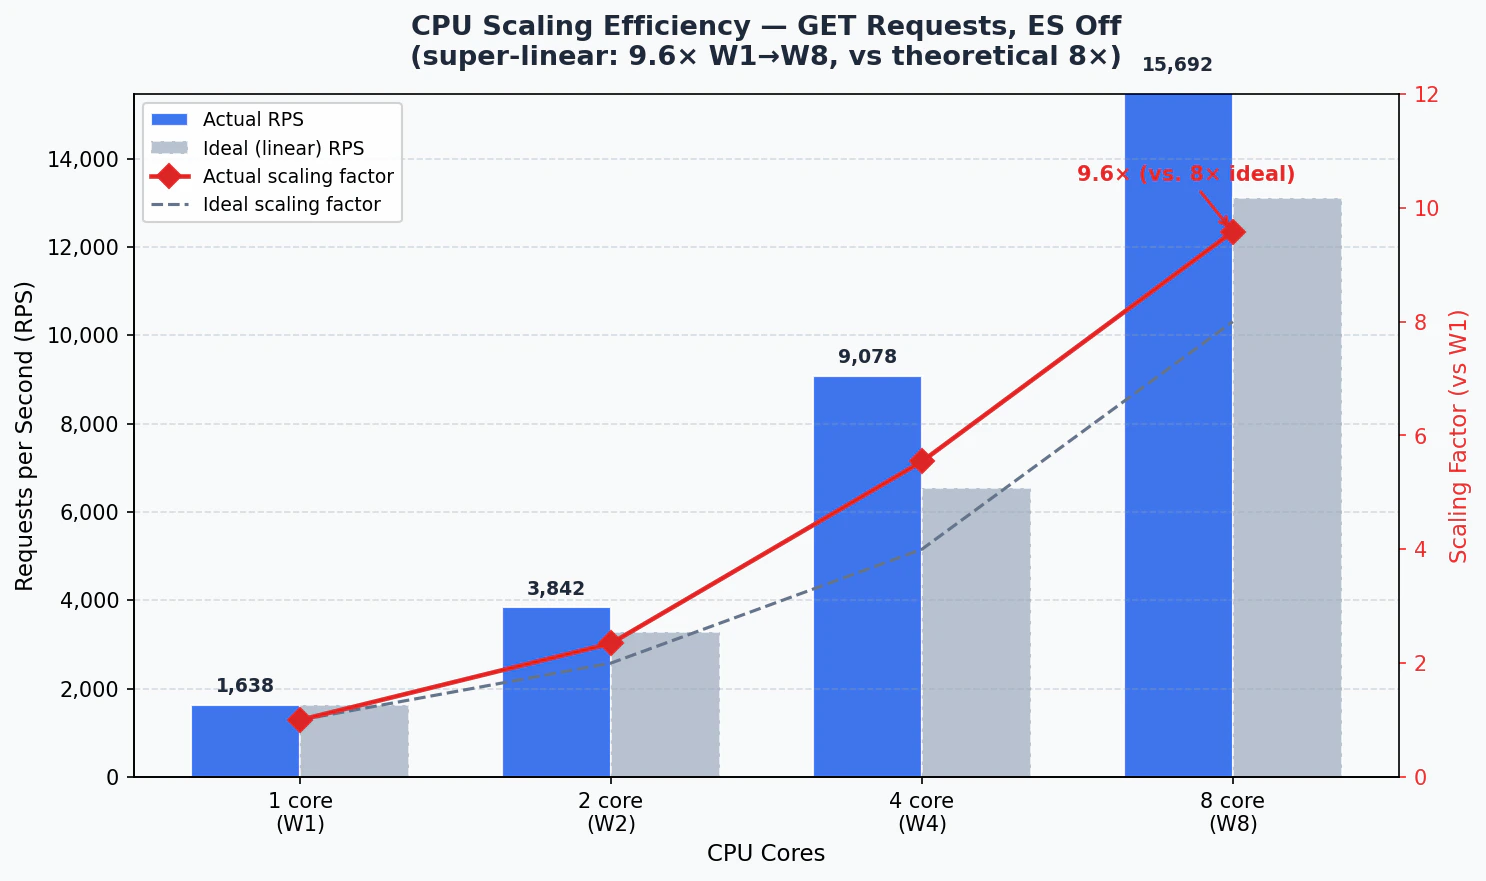 Total increase from W1 to W8 is **9.6×**. Exceeding the theoretical ideal of 8× (120% efficiency) demonstrates that the gateway achieves super-linear scaling through its shared connection pool and virtual thread model.
***
### 3. ES On vs. ES Off Comparison
| Tier | ES Off | ES On | Overhead |
| ---- | -----: | -----: | -------: |
| W1 | 1,638 | 1,422 | 13.2% |
| W2 | 3,842 | 3,385 | 11.9% |
| W4 | 9,078 | 7,490 | 17.5% |
| W8 | 15,692 | 14,256 | **9.2%** |
| Tier | ES Off | ES On | Overhead |
| ---- | -----: | -----: | -------: |
| W1 | 1,480 | 1,342 | 9.3% |
| W2 | 3,322 | 2,498 | 24.8% |
| W4 | 8,019 | 5,980 | 25.4% |
| W8 | 12,992 | 12,704 | **2.2%** |
| Tier | ES Off | ES On | Overhead |
| ---- | -----: | ----: | -------: |
| W1 | 1,352 | 1,148 | 15.1% |
| W2 | 3,097 | 2,237 | 27.8% |
| W4 | 6,573 | 5,147 | 21.7% |
| W8 | 6,431 | 6,543 | \~0% |
Total increase from W1 to W8 is **9.6×**. Exceeding the theoretical ideal of 8× (120% efficiency) demonstrates that the gateway achieves super-linear scaling through its shared connection pool and virtual thread model.
***
### 3. ES On vs. ES Off Comparison
| Tier | ES Off | ES On | Overhead |
| ---- | -----: | -----: | -------: |
| W1 | 1,638 | 1,422 | 13.2% |
| W2 | 3,842 | 3,385 | 11.9% |
| W4 | 9,078 | 7,490 | 17.5% |
| W8 | 15,692 | 14,256 | **9.2%** |
| Tier | ES Off | ES On | Overhead |
| ---- | -----: | -----: | -------: |
| W1 | 1,480 | 1,342 | 9.3% |
| W2 | 3,322 | 2,498 | 24.8% |
| W4 | 8,019 | 5,980 | 25.4% |
| W8 | 12,992 | 12,704 | **2.2%** |
| Tier | ES Off | ES On | Overhead |
| ---- | -----: | ----: | -------: |
| W1 | 1,352 | 1,148 | 15.1% |
| W2 | 3,097 | 2,237 | 27.8% |
| W4 | 6,573 | 5,147 | 21.7% |
| W8 | 6,431 | 6,543 | \~0% |
 ***
### 4. Concurrency Curves (Per Tier)
**GET**
| Conns | ES-OFF RPS | ES-OFF P50 | ES-OFF P99 | ES-ON RPS | ES-ON P50 | ES-ON P99 |
| :---: | ---------: | ---------: | ---------: | --------: | --------: | --------: |
| 100 | 1,447 | 56 ms | 3.15 s | 1,198 | 29 ms | 720 ms |
| 250 | 1,448 | 57 ms | 384 ms | 1,198 | 31 ms | 165 ms |
| 500 | **1,638** | 55 ms | 461 ms | **1,422** | 65 ms | 304 ms |
**POST 1KB**
| Conns | ES-OFF RPS | ES-OFF P50 | ES-OFF P99 | ES-ON RPS | ES-ON P50 | ES-ON P99 |
| :---: | ---------: | ---------: | ---------: | --------: | --------: | --------: |
| 100 | 1,338 | 2.48 s | 5.91 s | 1,097 | 36 ms | 652 ms |
| 250 | 1,348 | 103 ms | 1.57 s | 1,099 | 45 ms | 658 ms |
| 500 | **1,480** | 93 ms | 1.11 s | **1,342** | 65 ms | 297 ms |
**POST 5KB**
| Conns | ES-OFF RPS | ES-OFF P50 | ES-OFF P99 | ES-ON RPS | ES-ON P50 | ES-ON P99 |
| :---: | ---------: | ---------: | ---------: | --------: | --------: | --------: |
| 100 | 1,196 | 61 ms | 1.38 s | 899 | 27 ms | 225 ms |
| 250 | 1,199 | 70 ms | 796 ms | 898 | 32 ms | 211 ms |
| 500 | **1,352** | 107 ms | 540 ms | **1,148** | 45 ms | 496 ms |
**GET**
| Conns | ES-OFF RPS | ES-OFF P50 | ES-OFF P99 | ES-ON RPS | ES-ON P50 | ES-ON P99 |
| :---: | ---------: | ---------: | ---------: | --------: | --------: | --------: |
| 250 | 3,498 | 58 ms | 3.03 s | 2,995 | 43 ms | 1.30 s |
| 500 | 3,493 | 73 ms | 653 ms | 2,996 | 92 ms | 2.79 s |
| 750 | 3,493 | 57 ms | 427 ms | 2,993 | 91 ms | 1.52 s |
| 1,000 | **3,842** | 81 ms | 396 ms | **3,385** | 74 ms | 1.29 s |
**POST 1KB**
| Conns | ES-OFF RPS | ES-OFF P50 | ES-OFF P99 | ES-ON RPS | ES-ON P50 | ES-ON P99 |
| :---: | ---------: | ---------: | ---------: | --------: | --------: | --------: |
| 250 | 2,746 | 45 ms | 1.32 s | 2,246 | 13 ms | 313 ms |
| 500 | 2,745 | 41 ms | 305 ms | 2,246 | 23 ms | 709 ms |
| 750 | 2,746 | 31 ms | 222 ms | 2,246 | 48 ms | 531 ms |
| 1,000 | **3,322** | 56 ms | 391 ms | **2,498** | 95 ms | 550 ms |
**POST 5KB**
| Conns | ES-OFF RPS | ES-OFF P50 | ES-OFF P99 | ES-ON RPS | ES-ON P50 | ES-ON P99 |
| :---: | ---------: | ---------: | ---------: | --------: | --------: | --------: |
| 250 | 2,496 | 26 ms | 413 ms | 1,996 | 42 ms | 320 ms |
| 500 | 2,497 | 44 ms | 880 ms | 1,997 | 69 ms | 2.33 s |
| 750 | 2,494 | 73 ms | 293 ms | 1,997 | 59 ms | 967 ms |
| 1,000 | **3,097** | 87 ms | 319 ms | **2,237** | 139 ms | 1.63 s |
**GET**
| Conns | ES-OFF RPS | ES-OFF P50 | ES-OFF P99 | ES-ON RPS | ES-ON P50 | ES-ON P99 |
| :---: | ---------: | ---------: | ---------: | --------: | --------: | --------: |
| 250 | 8,441 | 10.9 s | 21.0 s | 7,145 | 10.7 s | 17.1 s |
| 500 | 8,898 | 1.75 s | 7.96 s | 7,490 | 56 ms | 1.37 s |
| 1,000 | 8,929 | 772 ms | 5.06 s | 7,478 | 162 ms | 2.68 s |
| 2,000 | **9,078** | 193 ms | 4.00 s | 6,836 | 12.4 s | 26.6 s |
**POST 1KB**
| Conns | ES-OFF RPS | ES-OFF P50 | ES-OFF P99 | ES-ON RPS | ES-ON P50 | ES-ON P99 |
| :---: | ---------: | ---------: | ---------: | --------: | --------: | --------: |
| 250 | 7,382 | 22.7 s | 35.7 s | 5,104 | 24.5 s | 49.9 s |
| 500 | 7,377 | 14.8 s | 37.8 s | 5,699 | 11.2 s | 31.2 s |
| 1,000 | 7,727 | 8.88 s | 25.3 s | 5,656 | 7.06 s | 34.0 s |
| 2,000 | **8,019** | 1.65 s | 8.79 s | **5,980** | 7.41 s | 20.4 s |
**POST 5KB**
| Conns | ES-OFF RPS | ES-OFF P50 | ES-OFF P99 | ES-ON RPS | ES-ON P50 | ES-ON P99 |
| :---: | ---------: | ---------: | ---------: | --------: | --------: | --------: |
| 250 | 5,215 | 24.4 s | 42.5 s | 4,330 | 13.2 s | 29.1 s |
| 500 | 5,919 | 6.26 s | 18.1 s | 4,700 | 2.23 s | 8.15 s |
| 1,000 | 6,071 | 2.13 s | 12.4 s | 4,705 | 2.02 s | 8.52 s |
| 2,000 | **6,573** | 630 ms | 6.56 s | **5,147** | 1.44 s | 7.89 s |
**GET**
| Conns | ES-OFF RPS | ES-OFF P50 | ES-OFF P99 | ES-ON RPS | ES-ON P50 | ES-ON P99 |
| :---: | ---------: | ---------: | ---------: | ---------: | --------: | --------: |
| 250 | 13,893 | 33 ms | 3.74 s | 12,983 | 21 ms | 2.90 s |
| 500 | 13,964 | 32 ms | 2.10 s | 12,893 | 115 ms | 2.08 s |
| 1,000 | 13,972 | 30 ms | 1.21 s | 12,972 | 36 ms | 1.29 s |
| 2,000 | 13,960 | 67 ms | 6.06 s | 12,804 | 98 ms | 5.04 s |
| 3,000 | — | — | — | **14,256** | 1.70 s | 6.57 s |
| 4,000 | **15,692** | 319 ms | 4.06 s | — | — | — |
**POST 1KB**
| Conns | ES-OFF RPS | ES-OFF P50 | ES-OFF P99 | ES-ON RPS | ES-ON P50 | ES-ON P99 |
| :---: | ---------: | ---------: | ---------: | ---------: | --------: | --------: |
| 250 | 12,992 | 159 ms | 5.79 s | 11,984 | 45 ms | 1.68 s |
| 500 | 12,974 | 35 ms | 3.45 s | 11,825 | 2.20 s | 8.69 s |
| 1,000 | 12,972 | 46 ms | 2.44 s | 11,978 | 246 ms | 4.09 s |
| 2,000 | 12,963 | 77 ms | 2.58 s | 11,948 | 513 ms | 5.45 s |
| 3,000 | — | — | — | **12,704** | 153 ms | 3.91 s |
| 4,000 | **12,988** | 742 ms | 19.1 s | — | — | — |
**POST 5KB**
| Conns | ES-OFF RPS | ES-OFF P50 | ES-OFF P99 | ES-ON RPS | ES-ON P50 | ES-ON P99 |
| :---: | ---------: | ---------: | ---------: | --------: | --------: | --------: |
| 250 | 6,431 | 1.39 s | 5.98 s | 5,793 | 2.22 s | 13.8 s |
| 500 | 6,420 | 74 ms | 4.65 s | 5,928 | 80 ms | 4.81 s |
| 1,000 | 6,377 | 3.10 s | 15.6 s | 5,985 | 55 ms | 4.07 s |
| 2,000 | 6,347 | 625 ms | 13.6 s | 5,985 | 178 ms | 1.60 s |
| 3,000 | — | — | — | **6,543** | 263 ms | 1.61 s |
| 4,000 | **6,423** | 4.04 s | 29.5 s | — | — | — |
***
### 5. JVM Diagnostics
| Tier | Heap Usage | Young GC | Old GC | Threads (Peak) | Blocked |
| ---- | -------------------: | --------------: | -----: | :------------: | :-----: |
| W1 | 135 / 1,189 MB (11%) | 14,923× / 343 s | **0** | 351 | **0** |
| W2 | 201 / 1,230 MB (16%) | 7,245× / 156 s | **0** | 609 | **0** |
| W4 | 724 / 2,664 MB (27%) | 10,570× / 213 s | **0** | 1,129 | **0** |
| W8 | 933 / 5,328 MB (18%) | 14,308× / 192 s | **0** | 3,189 | **0** |
| Tier | Heap Usage | Young GC | Old GC | Threads (Peak) | Blocked |
| ---- | ---------------------: | --------------: | ---------: | :------------: | :-----: |
| W1 | 455 / 1,189 MB (38%) | 15,364× / 311 s | 0 | 354 | **0** |
| W2 | 791 / 1,230 MB (64%) | 11,430× / 392 s | 40× / 10 s | 612 | **0** |
| W4 | 1,918 / 2,664 MB (72%) | 12,037× / 711 s | 23× / 9 s | 1,132 | **0** |
| W8 | 2,983 / 5,328 MB (56%) | 11,491× / 600 s | **0** | 3,120 | **0** |
Blocked thread count remained **0** across all tiers and modes. No deadlocks or resource contention occurred.
***
## Policy Performance Impact
Benchmark results reflect zero-policy routing. In real production scenarios, each policy adds its own cost depending on its mechanism. These costs fall into two categories: **CPU load** and **external latency**.
### CPU-Intensive Policies — Reduce Throughput
These policies perform computation on the gateway for each request. CPU is consumed directly and can be compensated by scaling up the tier or adding horizontal replicas.
The request or response body is parsed and validated against a loaded XSD schema on every call. Schema complexity and message size increase CPU consumption linearly.
For example, a complex XSD schema on a 50KB XML body can reduce throughput by 30–60% on its own. If the schema is simple and messages are small, the impact remains limited.
XSLT runs a full XML parse and template transformation cycle on the gateway for every request. A complex XSLT template alone is sufficient to double CPU consumption.
Processing cost differs significantly between XSLT 1.0 and 2.0. W4 or higher tiers are recommended for large messages or frequently triggered endpoints.
The JSON equivalent of XSD validation. The JSON body is parsed and traversed against defined JSON Schema rules on each request. Schema depth (number of nested objects) and message size are the primary CPU drivers.
XML encryption, WS-Security body encryption, or JWE token decryption involve cryptographic operations that significantly increase CPU usage. Asymmetric encryption (RSA) carries a much higher cost than symmetric alternatives (AES).
Computing or verifying a signature per request requires cryptographic operations. RSA-2048 or RSA-4096 based signatures place a noticeable throughput burden compared to HMAC-based alternatives. Algorithm selection matters for high-traffic endpoints.
Body content is scanned against regex or custom rules, evaluating the full message on every request. As rule count grows and messages get larger, CPU cost escalates non-linearly.
Groovy scripts run on the JVM with startup compilation cost reduced through script caching. However, script complexity directly determines CPU usage. Loop-heavy, parse-intensive, or computation-heavy scripts can substantially reduce throughput.
### Policies That Add External Latency — Increase Response Time
These policies connect to an external system to perform work. Gateway CPU is largely idle while waiting; response time increases by the round-trip to the external system. Scaling up CPU does not reduce this latency — the external system's performance and network RTT are the controlling factors.
Each request connects to an LDAP server to verify username and password. The network round-trip to the LDAP server (typically 1–10 ms) is added to every request. Without connection pooling, connection setup cost also applies per request.
If the LDAP server is in the same datacenter, impact is relatively contained. Across datacenters or in cloud environments, latency can reach tens of milliseconds and throughput drops disproportionately.
The token is sent to the Authorization Server for validation on every request. Response time depends entirely on the AS's response speed. Without token caching, this creates significant pressure on both throughput and latency.
With token caching enabled, cost can be substantially reduced depending on the cache miss rate. Cache TTL should be set carefully based on business requirements.
If the signing key must be fetched from a remote JWKS endpoint, each key retrieval is a network call. When JWKS caching is enabled, this cost is largely eliminated; no additional latency occurs as long as the cache remains valid.
When SAML assertions need to be validated against an IdP (Identity Provider), an external connection is unavoidable. WS-Trust or SOAP-based IdP calls add both network latency and processing cost.
If authentication credentials forwarded to the backend service need to be renewed or validated per request (e.g., dynamic token retrieval), an additional external call is made. No cost is incurred when static credentials are used.
Calling another API within the policy pipeline adds the called API's response time as latency. Multiple sequential API calls multiply latency. This cost can be minimized through conditional execution and result caching.
### Low-Impact Policies
The following policies add minimal CPU and zero external latency on the gateway. Their impact on performance is generally negligible even in high-traffic environments.
Incoming IP is compared against an in-memory list. Completes in microseconds.
Counting against local counters or shared cache. Pure in-memory operation when no external cache integration is present.
Adding, removing, or modifying specific headers are string operations; CPU cost is negligible.
When credentials are defined on the gateway without an external LDAP/directory service, validation is entirely in-memory.
Policies that add external latency also reduce throughput — threads waiting for external responses cannot serve new requests. For policies that depend on external system calls, high-thread-capacity tiers like W8 significantly mitigate this effect.
***
## Analysis
GET throughput increased **9.6×** from W1 to W8. Exceeding the theoretical ideal of 8× (120% efficiency) demonstrates super-linear scaling made possible by the shared connection pool and Java virtual thread model working together.
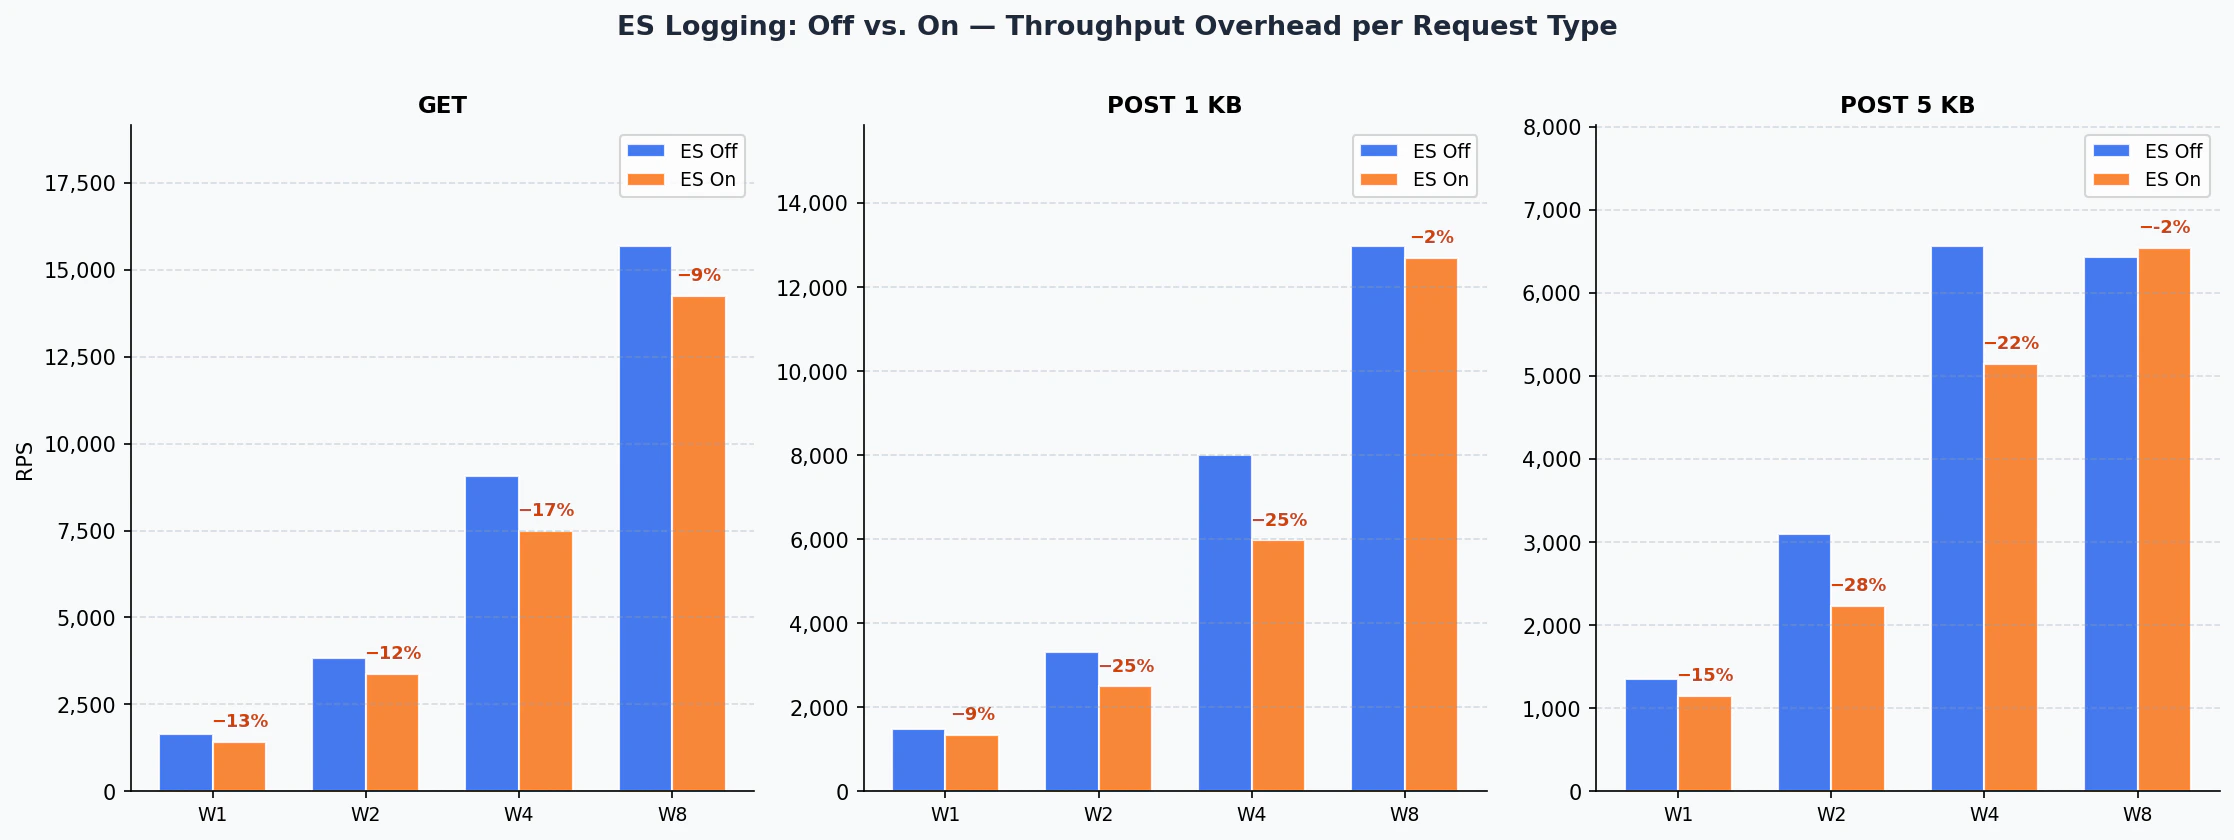
ES logging overhead decreases disproportionately as tier size grows. At W8, overhead is just 9% for GET and 2% for POST 1KB. The asynchronous processing capacity of 8 CPUs largely absorbs Elasticsearch write latency.
Limit CPU-intensive policies (XSLT, encryption, schema validation) to only the necessary endpoints using conditional execution. Back latency-adding policies (LDAP, OAuth2 introspection) with token or result caching. Applying both measures together eliminates the majority of policy cost.
The values below represent the zero-policy baseline (routing + ES logging only). Actual capacity with policy load will be lower.
| Expected Load | Recommended Starting Tier |
| :--------------: | :-----------------------: |
| \< 1,000 RPS | W1 |
| 1,000–3,000 RPS | W2 |
| 3,000–7,000 RPS | W4 |
| 7,000–14,000 RPS | W8 |
| > 14,000 RPS | W8 × N (horizontal scale) |
***
## Cache Performance
The Cache component stores API responses in memory, serving repeated requests directly without forwarding them to the backend. The results below show the maximum capacity of the cache component for GET (read) and PUT (write) operations across different resource configurations.
The Cache component is **Hazelcast**-based and runs with the **ZGC** garbage collector. JVM parameters are automatically determined by the entrypoint for each tier. Test methodology is the same as the gateway benchmark (R=999999 overload, wrk2).
### Cache Resource Configurations
| Tier | CPU | Memory | Hazelcast Op Threads | VT Parallelism |
| ------ | :-: | :----: | :------------------: | :------------: |
| **W1** | 1 | 2 GB | 2 | 1 |
| **W2** | 2 | 2 GB | 4 | 2 |
| **W4** | 4 | 4 GB | 8 | 4 |
| **W8** | 8 | 8 GB | 16 | 8 |
### Peak Throughput
| Tier | CPU | GET (RPS) | PUT (RPS) |
| ---- | :-: | ---------: | ---------: |
| W1 | 1 | **2,169** | **1,974** |
| W2 | 2 | **5,037** | **3,673** |
| W4 | 4 | **7,896** | **6,632** |
| W8 | 8 | **13,619** | **13,069** |
### CPU Scaling Efficiency
| Tier | CPU | GET RPS | GET/CPU | PUT RPS | PUT/CPU | Scaling (GET) |
| ---- | :-: | ------: | ------: | ------: | ------: | :-----------: |
| W1 | 1 | 2,169 | 2,169 | 1,974 | 1,974 | 1.00× |
| W2 | 2 | 5,037 | 2,519 | 3,673 | 1,837 | **1.16×** |
| W4 | 4 | 7,896 | 1,974 | 6,632 | 1,658 | **0.91×** |
| W8 | 8 | 13,619 | 1,702 | 13,069 | 1,634 | **0.79×** |
Total increase from W1 to W8 is **6.3×** for GET and **6.6×** for PUT, demonstrating near-linear scaling relative to CPU increase (8×). PUT operations reach near-parity with GET at W8, showing that write bottlenecks are eliminated at higher CPU counts.
### Cache Capacity Planning
| Expected Cache Load | Recommended Starting Tier |
| :-----------------: | :-----------------------: |
| \< 2,000 RPS | W1 |
| 2,000–5,000 RPS | W2 |
| 5,000–10,000 RPS | W4 |
| > 10,000 RPS | W8 |
**Benchmark Version**: v1 · **Test Date**: March 27, 2026 · **Methodology**: R=999999 overload, 300 s × 1 run · **Environment**: Kubernetes (isolated pod), Hazelcast 5.5 + Java 25 ZGC
***
## Next Steps
Review hardware requirements and sizing guidance
Explore deployment topologies and high availability options
Learn about policy types and the application mechanism
Understand the gateway's request flow and policy ordering
***
**Benchmark Version**: v8 · **Test Date**: March 14, 2026 · **Methodology**: R=999999 overload, 300 s × 3 runs · **Environment**: Kubernetes (isolated pod), Undertow + Java 25 Virtual Threads
***
### 4. Concurrency Curves (Per Tier)
**GET**
| Conns | ES-OFF RPS | ES-OFF P50 | ES-OFF P99 | ES-ON RPS | ES-ON P50 | ES-ON P99 |
| :---: | ---------: | ---------: | ---------: | --------: | --------: | --------: |
| 100 | 1,447 | 56 ms | 3.15 s | 1,198 | 29 ms | 720 ms |
| 250 | 1,448 | 57 ms | 384 ms | 1,198 | 31 ms | 165 ms |
| 500 | **1,638** | 55 ms | 461 ms | **1,422** | 65 ms | 304 ms |
**POST 1KB**
| Conns | ES-OFF RPS | ES-OFF P50 | ES-OFF P99 | ES-ON RPS | ES-ON P50 | ES-ON P99 |
| :---: | ---------: | ---------: | ---------: | --------: | --------: | --------: |
| 100 | 1,338 | 2.48 s | 5.91 s | 1,097 | 36 ms | 652 ms |
| 250 | 1,348 | 103 ms | 1.57 s | 1,099 | 45 ms | 658 ms |
| 500 | **1,480** | 93 ms | 1.11 s | **1,342** | 65 ms | 297 ms |
**POST 5KB**
| Conns | ES-OFF RPS | ES-OFF P50 | ES-OFF P99 | ES-ON RPS | ES-ON P50 | ES-ON P99 |
| :---: | ---------: | ---------: | ---------: | --------: | --------: | --------: |
| 100 | 1,196 | 61 ms | 1.38 s | 899 | 27 ms | 225 ms |
| 250 | 1,199 | 70 ms | 796 ms | 898 | 32 ms | 211 ms |
| 500 | **1,352** | 107 ms | 540 ms | **1,148** | 45 ms | 496 ms |
**GET**
| Conns | ES-OFF RPS | ES-OFF P50 | ES-OFF P99 | ES-ON RPS | ES-ON P50 | ES-ON P99 |
| :---: | ---------: | ---------: | ---------: | --------: | --------: | --------: |
| 250 | 3,498 | 58 ms | 3.03 s | 2,995 | 43 ms | 1.30 s |
| 500 | 3,493 | 73 ms | 653 ms | 2,996 | 92 ms | 2.79 s |
| 750 | 3,493 | 57 ms | 427 ms | 2,993 | 91 ms | 1.52 s |
| 1,000 | **3,842** | 81 ms | 396 ms | **3,385** | 74 ms | 1.29 s |
**POST 1KB**
| Conns | ES-OFF RPS | ES-OFF P50 | ES-OFF P99 | ES-ON RPS | ES-ON P50 | ES-ON P99 |
| :---: | ---------: | ---------: | ---------: | --------: | --------: | --------: |
| 250 | 2,746 | 45 ms | 1.32 s | 2,246 | 13 ms | 313 ms |
| 500 | 2,745 | 41 ms | 305 ms | 2,246 | 23 ms | 709 ms |
| 750 | 2,746 | 31 ms | 222 ms | 2,246 | 48 ms | 531 ms |
| 1,000 | **3,322** | 56 ms | 391 ms | **2,498** | 95 ms | 550 ms |
**POST 5KB**
| Conns | ES-OFF RPS | ES-OFF P50 | ES-OFF P99 | ES-ON RPS | ES-ON P50 | ES-ON P99 |
| :---: | ---------: | ---------: | ---------: | --------: | --------: | --------: |
| 250 | 2,496 | 26 ms | 413 ms | 1,996 | 42 ms | 320 ms |
| 500 | 2,497 | 44 ms | 880 ms | 1,997 | 69 ms | 2.33 s |
| 750 | 2,494 | 73 ms | 293 ms | 1,997 | 59 ms | 967 ms |
| 1,000 | **3,097** | 87 ms | 319 ms | **2,237** | 139 ms | 1.63 s |
**GET**
| Conns | ES-OFF RPS | ES-OFF P50 | ES-OFF P99 | ES-ON RPS | ES-ON P50 | ES-ON P99 |
| :---: | ---------: | ---------: | ---------: | --------: | --------: | --------: |
| 250 | 8,441 | 10.9 s | 21.0 s | 7,145 | 10.7 s | 17.1 s |
| 500 | 8,898 | 1.75 s | 7.96 s | 7,490 | 56 ms | 1.37 s |
| 1,000 | 8,929 | 772 ms | 5.06 s | 7,478 | 162 ms | 2.68 s |
| 2,000 | **9,078** | 193 ms | 4.00 s | 6,836 | 12.4 s | 26.6 s |
**POST 1KB**
| Conns | ES-OFF RPS | ES-OFF P50 | ES-OFF P99 | ES-ON RPS | ES-ON P50 | ES-ON P99 |
| :---: | ---------: | ---------: | ---------: | --------: | --------: | --------: |
| 250 | 7,382 | 22.7 s | 35.7 s | 5,104 | 24.5 s | 49.9 s |
| 500 | 7,377 | 14.8 s | 37.8 s | 5,699 | 11.2 s | 31.2 s |
| 1,000 | 7,727 | 8.88 s | 25.3 s | 5,656 | 7.06 s | 34.0 s |
| 2,000 | **8,019** | 1.65 s | 8.79 s | **5,980** | 7.41 s | 20.4 s |
**POST 5KB**
| Conns | ES-OFF RPS | ES-OFF P50 | ES-OFF P99 | ES-ON RPS | ES-ON P50 | ES-ON P99 |
| :---: | ---------: | ---------: | ---------: | --------: | --------: | --------: |
| 250 | 5,215 | 24.4 s | 42.5 s | 4,330 | 13.2 s | 29.1 s |
| 500 | 5,919 | 6.26 s | 18.1 s | 4,700 | 2.23 s | 8.15 s |
| 1,000 | 6,071 | 2.13 s | 12.4 s | 4,705 | 2.02 s | 8.52 s |
| 2,000 | **6,573** | 630 ms | 6.56 s | **5,147** | 1.44 s | 7.89 s |
**GET**
| Conns | ES-OFF RPS | ES-OFF P50 | ES-OFF P99 | ES-ON RPS | ES-ON P50 | ES-ON P99 |
| :---: | ---------: | ---------: | ---------: | ---------: | --------: | --------: |
| 250 | 13,893 | 33 ms | 3.74 s | 12,983 | 21 ms | 2.90 s |
| 500 | 13,964 | 32 ms | 2.10 s | 12,893 | 115 ms | 2.08 s |
| 1,000 | 13,972 | 30 ms | 1.21 s | 12,972 | 36 ms | 1.29 s |
| 2,000 | 13,960 | 67 ms | 6.06 s | 12,804 | 98 ms | 5.04 s |
| 3,000 | — | — | — | **14,256** | 1.70 s | 6.57 s |
| 4,000 | **15,692** | 319 ms | 4.06 s | — | — | — |
**POST 1KB**
| Conns | ES-OFF RPS | ES-OFF P50 | ES-OFF P99 | ES-ON RPS | ES-ON P50 | ES-ON P99 |
| :---: | ---------: | ---------: | ---------: | ---------: | --------: | --------: |
| 250 | 12,992 | 159 ms | 5.79 s | 11,984 | 45 ms | 1.68 s |
| 500 | 12,974 | 35 ms | 3.45 s | 11,825 | 2.20 s | 8.69 s |
| 1,000 | 12,972 | 46 ms | 2.44 s | 11,978 | 246 ms | 4.09 s |
| 2,000 | 12,963 | 77 ms | 2.58 s | 11,948 | 513 ms | 5.45 s |
| 3,000 | — | — | — | **12,704** | 153 ms | 3.91 s |
| 4,000 | **12,988** | 742 ms | 19.1 s | — | — | — |
**POST 5KB**
| Conns | ES-OFF RPS | ES-OFF P50 | ES-OFF P99 | ES-ON RPS | ES-ON P50 | ES-ON P99 |
| :---: | ---------: | ---------: | ---------: | --------: | --------: | --------: |
| 250 | 6,431 | 1.39 s | 5.98 s | 5,793 | 2.22 s | 13.8 s |
| 500 | 6,420 | 74 ms | 4.65 s | 5,928 | 80 ms | 4.81 s |
| 1,000 | 6,377 | 3.10 s | 15.6 s | 5,985 | 55 ms | 4.07 s |
| 2,000 | 6,347 | 625 ms | 13.6 s | 5,985 | 178 ms | 1.60 s |
| 3,000 | — | — | — | **6,543** | 263 ms | 1.61 s |
| 4,000 | **6,423** | 4.04 s | 29.5 s | — | — | — |
***
### 5. JVM Diagnostics
| Tier | Heap Usage | Young GC | Old GC | Threads (Peak) | Blocked |
| ---- | -------------------: | --------------: | -----: | :------------: | :-----: |
| W1 | 135 / 1,189 MB (11%) | 14,923× / 343 s | **0** | 351 | **0** |
| W2 | 201 / 1,230 MB (16%) | 7,245× / 156 s | **0** | 609 | **0** |
| W4 | 724 / 2,664 MB (27%) | 10,570× / 213 s | **0** | 1,129 | **0** |
| W8 | 933 / 5,328 MB (18%) | 14,308× / 192 s | **0** | 3,189 | **0** |
| Tier | Heap Usage | Young GC | Old GC | Threads (Peak) | Blocked |
| ---- | ---------------------: | --------------: | ---------: | :------------: | :-----: |
| W1 | 455 / 1,189 MB (38%) | 15,364× / 311 s | 0 | 354 | **0** |
| W2 | 791 / 1,230 MB (64%) | 11,430× / 392 s | 40× / 10 s | 612 | **0** |
| W4 | 1,918 / 2,664 MB (72%) | 12,037× / 711 s | 23× / 9 s | 1,132 | **0** |
| W8 | 2,983 / 5,328 MB (56%) | 11,491× / 600 s | **0** | 3,120 | **0** |
Blocked thread count remained **0** across all tiers and modes. No deadlocks or resource contention occurred.
***
## Policy Performance Impact
Benchmark results reflect zero-policy routing. In real production scenarios, each policy adds its own cost depending on its mechanism. These costs fall into two categories: **CPU load** and **external latency**.
### CPU-Intensive Policies — Reduce Throughput
These policies perform computation on the gateway for each request. CPU is consumed directly and can be compensated by scaling up the tier or adding horizontal replicas.
The request or response body is parsed and validated against a loaded XSD schema on every call. Schema complexity and message size increase CPU consumption linearly.
For example, a complex XSD schema on a 50KB XML body can reduce throughput by 30–60% on its own. If the schema is simple and messages are small, the impact remains limited.
XSLT runs a full XML parse and template transformation cycle on the gateway for every request. A complex XSLT template alone is sufficient to double CPU consumption.
Processing cost differs significantly between XSLT 1.0 and 2.0. W4 or higher tiers are recommended for large messages or frequently triggered endpoints.
The JSON equivalent of XSD validation. The JSON body is parsed and traversed against defined JSON Schema rules on each request. Schema depth (number of nested objects) and message size are the primary CPU drivers.
XML encryption, WS-Security body encryption, or JWE token decryption involve cryptographic operations that significantly increase CPU usage. Asymmetric encryption (RSA) carries a much higher cost than symmetric alternatives (AES).
Computing or verifying a signature per request requires cryptographic operations. RSA-2048 or RSA-4096 based signatures place a noticeable throughput burden compared to HMAC-based alternatives. Algorithm selection matters for high-traffic endpoints.
Body content is scanned against regex or custom rules, evaluating the full message on every request. As rule count grows and messages get larger, CPU cost escalates non-linearly.
Groovy scripts run on the JVM with startup compilation cost reduced through script caching. However, script complexity directly determines CPU usage. Loop-heavy, parse-intensive, or computation-heavy scripts can substantially reduce throughput.
### Policies That Add External Latency — Increase Response Time
These policies connect to an external system to perform work. Gateway CPU is largely idle while waiting; response time increases by the round-trip to the external system. Scaling up CPU does not reduce this latency — the external system's performance and network RTT are the controlling factors.
Each request connects to an LDAP server to verify username and password. The network round-trip to the LDAP server (typically 1–10 ms) is added to every request. Without connection pooling, connection setup cost also applies per request.
If the LDAP server is in the same datacenter, impact is relatively contained. Across datacenters or in cloud environments, latency can reach tens of milliseconds and throughput drops disproportionately.
The token is sent to the Authorization Server for validation on every request. Response time depends entirely on the AS's response speed. Without token caching, this creates significant pressure on both throughput and latency.
With token caching enabled, cost can be substantially reduced depending on the cache miss rate. Cache TTL should be set carefully based on business requirements.
If the signing key must be fetched from a remote JWKS endpoint, each key retrieval is a network call. When JWKS caching is enabled, this cost is largely eliminated; no additional latency occurs as long as the cache remains valid.
When SAML assertions need to be validated against an IdP (Identity Provider), an external connection is unavoidable. WS-Trust or SOAP-based IdP calls add both network latency and processing cost.
If authentication credentials forwarded to the backend service need to be renewed or validated per request (e.g., dynamic token retrieval), an additional external call is made. No cost is incurred when static credentials are used.
Calling another API within the policy pipeline adds the called API's response time as latency. Multiple sequential API calls multiply latency. This cost can be minimized through conditional execution and result caching.
### Low-Impact Policies
The following policies add minimal CPU and zero external latency on the gateway. Their impact on performance is generally negligible even in high-traffic environments.
Incoming IP is compared against an in-memory list. Completes in microseconds.
Counting against local counters or shared cache. Pure in-memory operation when no external cache integration is present.
Adding, removing, or modifying specific headers are string operations; CPU cost is negligible.
When credentials are defined on the gateway without an external LDAP/directory service, validation is entirely in-memory.
Policies that add external latency also reduce throughput — threads waiting for external responses cannot serve new requests. For policies that depend on external system calls, high-thread-capacity tiers like W8 significantly mitigate this effect.
***
## Analysis
GET throughput increased **9.6×** from W1 to W8. Exceeding the theoretical ideal of 8× (120% efficiency) demonstrates super-linear scaling made possible by the shared connection pool and Java virtual thread model working together.
ES logging overhead decreases disproportionately as tier size grows. At W8, overhead is just 9% for GET and 2% for POST 1KB. The asynchronous processing capacity of 8 CPUs largely absorbs Elasticsearch write latency.
Limit CPU-intensive policies (XSLT, encryption, schema validation) to only the necessary endpoints using conditional execution. Back latency-adding policies (LDAP, OAuth2 introspection) with token or result caching. Applying both measures together eliminates the majority of policy cost.
The values below represent the zero-policy baseline (routing + ES logging only). Actual capacity with policy load will be lower.
| Expected Load | Recommended Starting Tier |
| :--------------: | :-----------------------: |
| \< 1,000 RPS | W1 |
| 1,000–3,000 RPS | W2 |
| 3,000–7,000 RPS | W4 |
| 7,000–14,000 RPS | W8 |
| > 14,000 RPS | W8 × N (horizontal scale) |
***
## Cache Performance
The Cache component stores API responses in memory, serving repeated requests directly without forwarding them to the backend. The results below show the maximum capacity of the cache component for GET (read) and PUT (write) operations across different resource configurations.
The Cache component is **Hazelcast**-based and runs with the **ZGC** garbage collector. JVM parameters are automatically determined by the entrypoint for each tier. Test methodology is the same as the gateway benchmark (R=999999 overload, wrk2).
### Cache Resource Configurations
| Tier | CPU | Memory | Hazelcast Op Threads | VT Parallelism |
| ------ | :-: | :----: | :------------------: | :------------: |
| **W1** | 1 | 2 GB | 2 | 1 |
| **W2** | 2 | 2 GB | 4 | 2 |
| **W4** | 4 | 4 GB | 8 | 4 |
| **W8** | 8 | 8 GB | 16 | 8 |
### Peak Throughput
| Tier | CPU | GET (RPS) | PUT (RPS) |
| ---- | :-: | ---------: | ---------: |
| W1 | 1 | **2,169** | **1,974** |
| W2 | 2 | **5,037** | **3,673** |
| W4 | 4 | **7,896** | **6,632** |
| W8 | 8 | **13,619** | **13,069** |
### CPU Scaling Efficiency
| Tier | CPU | GET RPS | GET/CPU | PUT RPS | PUT/CPU | Scaling (GET) |
| ---- | :-: | ------: | ------: | ------: | ------: | :-----------: |
| W1 | 1 | 2,169 | 2,169 | 1,974 | 1,974 | 1.00× |
| W2 | 2 | 5,037 | 2,519 | 3,673 | 1,837 | **1.16×** |
| W4 | 4 | 7,896 | 1,974 | 6,632 | 1,658 | **0.91×** |
| W8 | 8 | 13,619 | 1,702 | 13,069 | 1,634 | **0.79×** |
Total increase from W1 to W8 is **6.3×** for GET and **6.6×** for PUT, demonstrating near-linear scaling relative to CPU increase (8×). PUT operations reach near-parity with GET at W8, showing that write bottlenecks are eliminated at higher CPU counts.
### Cache Capacity Planning
| Expected Cache Load | Recommended Starting Tier |
| :-----------------: | :-----------------------: |
| \< 2,000 RPS | W1 |
| 2,000–5,000 RPS | W2 |
| 5,000–10,000 RPS | W4 |
| > 10,000 RPS | W8 |
**Benchmark Version**: v1 · **Test Date**: March 27, 2026 · **Methodology**: R=999999 overload, 300 s × 1 run · **Environment**: Kubernetes (isolated pod), Hazelcast 5.5 + Java 25 ZGC
***
## Next Steps
Review hardware requirements and sizing guidance
Explore deployment topologies and high availability options
Learn about policy types and the application mechanism
Understand the gateway's request flow and policy ordering
***
**Benchmark Version**: v8 · **Test Date**: March 14, 2026 · **Methodology**: R=999999 overload, 300 s × 3 runs · **Environment**: Kubernetes (isolated pod), Undertow + Java 25 Virtual Threads