> ## Documentation Index
> Fetch the complete documentation index at: https://docs.apinizer.com/llms.txt
> Use this file to discover all available pages before exploring further.
# Step-by-Step Tracing Tab
> Used to detect errors by monitoring the message traffic of the API Proxy. You can track the message flow step by step by activating trace mode, view policy execution results, and identify the source of problems.
## Starting step-by-step tracing mode
### Prerequisite: deployed to an environment
For an API Proxy to enter tracing mode, it must first be **deployed to at least one Environment**.
### Environment selection, filter, and Start
Select the **Environment** for which tracing will run and click **Start**. From the filter field next to the environment selector, use **Custom Query** to trace only the data you need.
 ### Mode duration and log content
When Step-by-Step Tracing is enabled, stored log content for the API Proxy is **expanded** for detailed review and remains in this form until the mode is stopped or automatically closed by the platform after **5 minutes**.
### Refreshing logs
Displayed log records are **not auto-refreshed**, so you do not lose rows you are inspecting. Use **Refresh Logs** to load the latest list.
***
## Log table
**Example log records:**
### Mode duration and log content
When Step-by-Step Tracing is enabled, stored log content for the API Proxy is **expanded** for detailed review and remains in this form until the mode is stopped or automatically closed by the platform after **5 minutes**.
### Refreshing logs
Displayed log records are **not auto-refreshed**, so you do not lose rows you are inspecting. Use **Refresh Logs** to load the latest list.
***
## Log table
**Example log records:**
 Each row in the table corresponds to a **request** from a client to this API Proxy and the **response** returned for it. Use the row-level actions below to work with that message.
Because the API Call Policy log is stored separately, you may see **duplicate logs** for the same request.
***
## Row actions
From the list view, use the row menu or shortcut buttons for the following.
### Detailed View
The **first** item in the menu at the end of the row opens a window with log records for that message.
Each row in the table corresponds to a **request** from a client to this API Proxy and the **response** returned for it. Use the row-level actions below to work with that message.
Because the API Call Policy log is stored separately, you may see **duplicate logs** for the same request.
***
## Row actions
From the list view, use the row menu or shortcut buttons for the following.
### Detailed View
The **first** item in the menu at the end of the row opens a window with log records for that message.
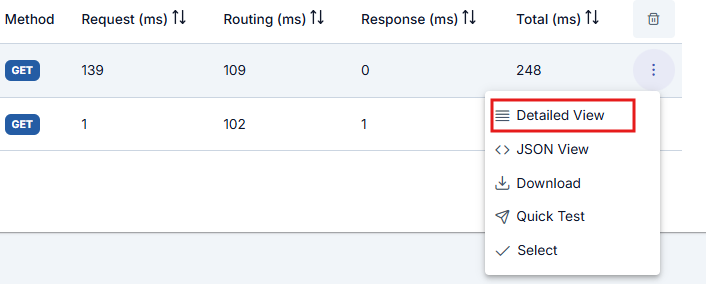 In the window, logs are grouped by message-flow section. Click the section to inspect (for example **Request From Client**). By default, **Overview** is open.
 ### JSON View
The button next to Detailed View shows log records in **JSON** format.
### JSON View
The button next to Detailed View shows log records in **JSON** format.
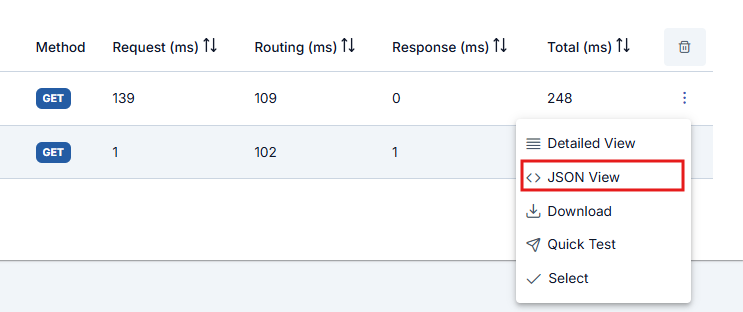 **Example dialog opened with JSON View:**
 ### Download
You can download log records in bulk for deeper analysis. While step-by-step tracing is on, Apinizer produces detailed logs for **all policies** executed for the API Proxy; download gathers per-request records in **one bundle**.
### Download
You can download log records in bulk for deeper analysis. While step-by-step tracing is on, Apinizer produces detailed logs for **all policies** executed for the API Proxy; download gathers per-request records in **one bundle**.
 ### Quick Test
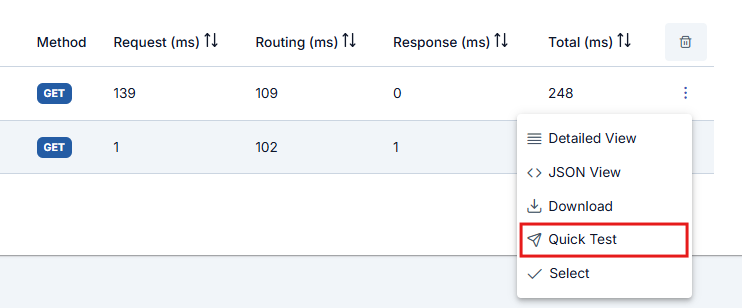
**Quick Test** on the row switches to the [Test Console](/en/develop/test-debug-tools/test-console) so you can resend the request for immediate testing.
### Quick Test
**Quick Test** on the row switches to the [Test Console](/en/develop/test-debug-tools/test-console) so you can resend the request for immediate testing.
 ***
## Trace detail: Select
Click **Select** to open detailed policy execution logs for the API Proxy while step-by-step tracing is active.
***
## Trace detail: Select
Click **Select** to open detailed policy execution logs for the API Proxy while step-by-step tracing is active.
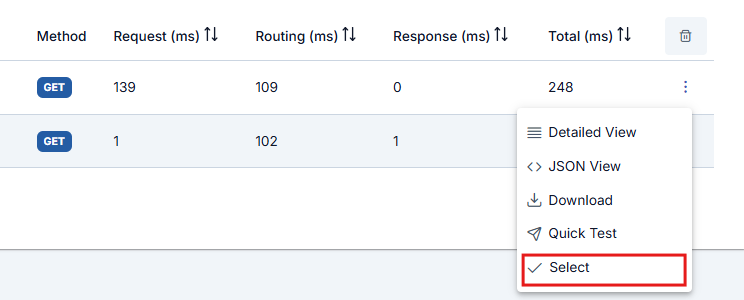 When you click a table row or choose **Select** from the row menu, the **trace detail drawer** opens on the **right** (wide drawer; horizontal scroll on narrow screens). The header shows the **HTTP method** (color badge), **path**, **HTTP status code**, and **result type** (for example SUCCESS). Use **X** to close.
## Time and flow
#### Timing breakdown
Total time (ms) and a colored bar show how time is split. Only segments with duration greater than zero are listed; labels can include **Request Parse**, **Request Policies**, **Routing**, **Response Policies**, and **Response Serialize**. Hover a segment to see its duration.
#### Flow map (Client → Gateway → API)
* Use **‹ Back** and **Next ›** to move through steps in order: **Client** → gateway ingress node → **request policies** (left to right) → gateway egress node → **API (target)** → return-from-target node → **response policies** → client egress node.
* **Click a node** to jump directly to that step.
* Successful steps show a green check; errors or blocks show **!**.
* **Skipped** policies appear faded, with an **S** badge and a tooltip that includes the skip reason.
***
### Lower panel: content for the selected step
Content is one or two columns depending on the step; sections use **accordions** (tables with **Name** / **Value**). JSON bodies appear in a read-only editor.
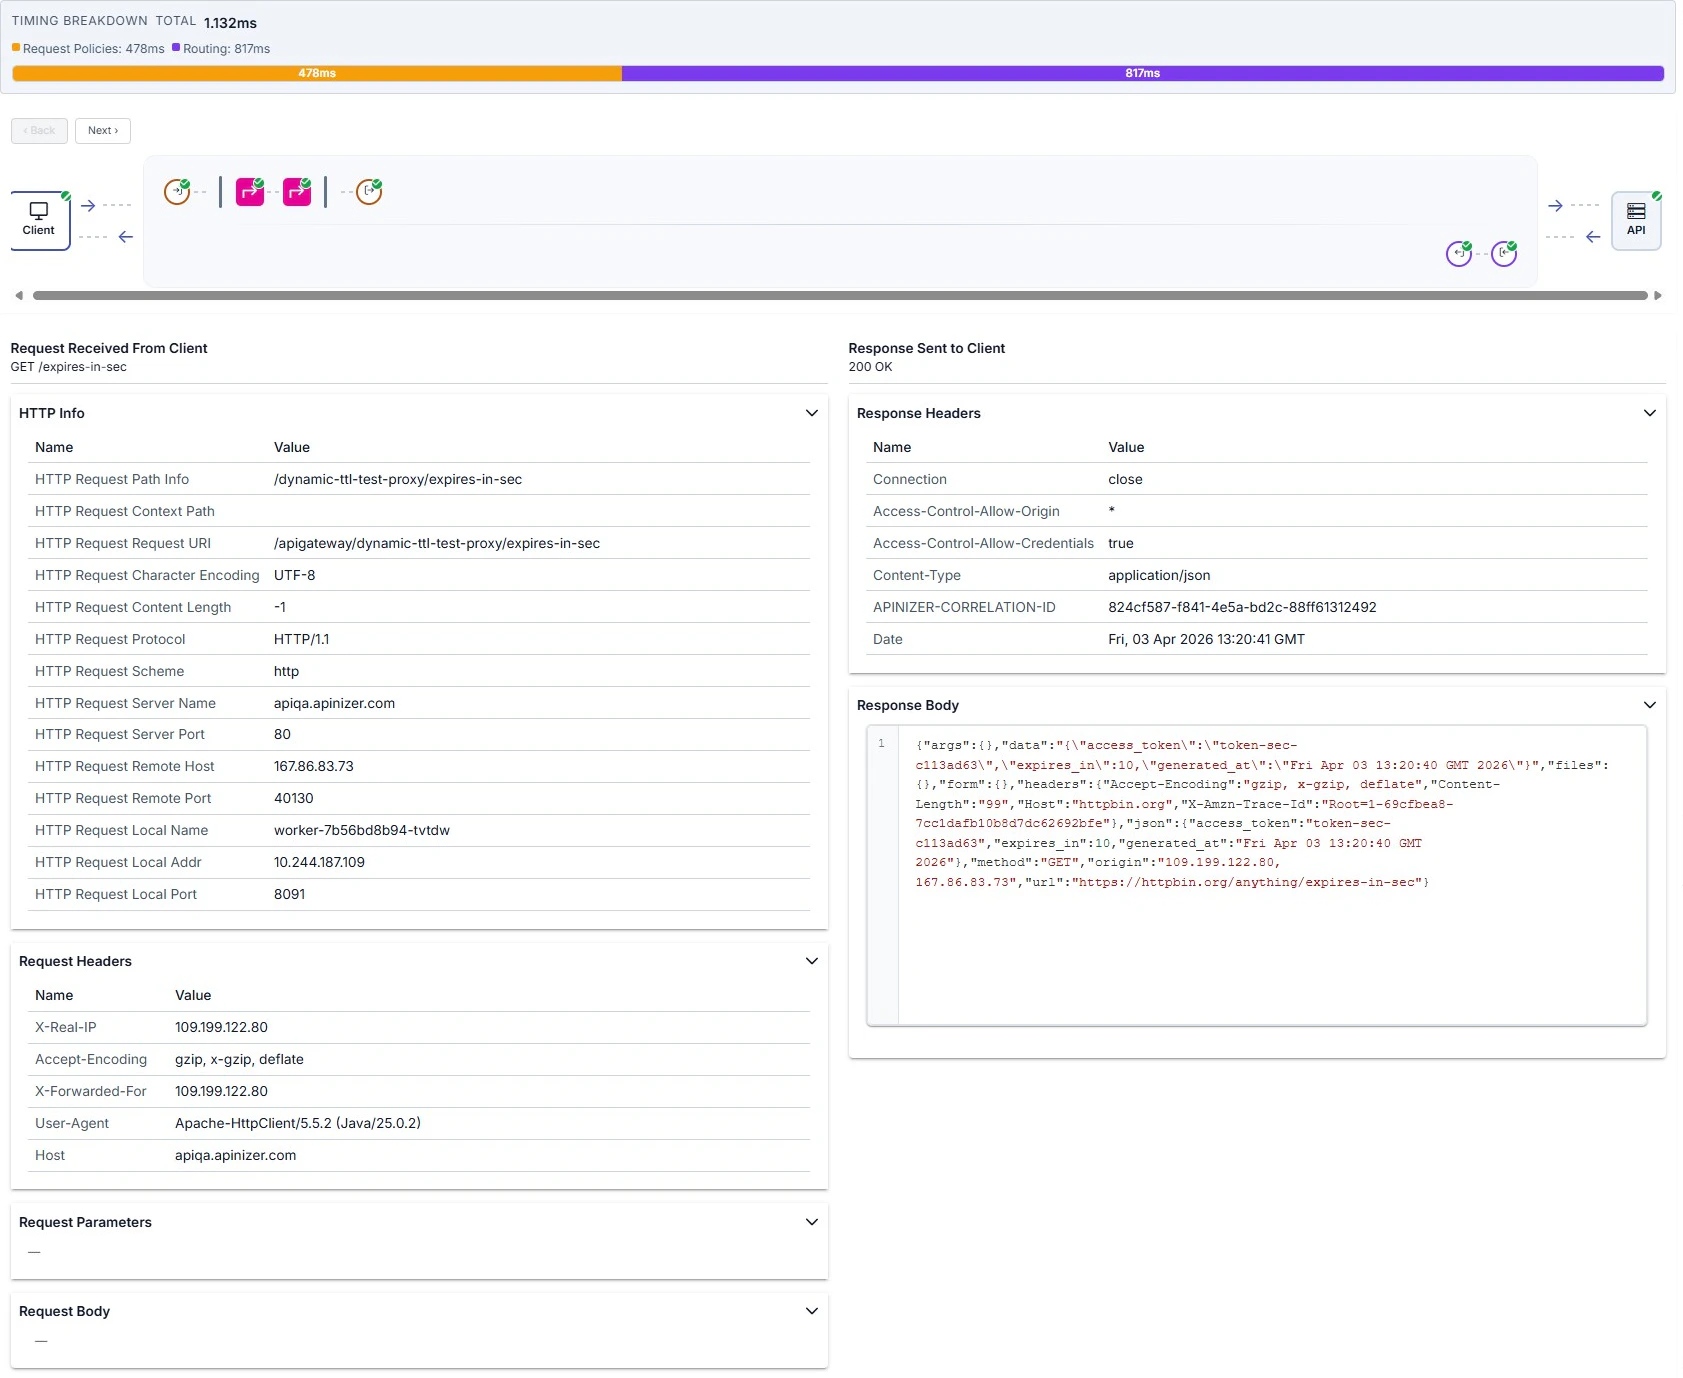
### Client
Left: request from client (**HTTP Info**, **Request Headers**, **Request Parameters**, **Request Body**). Right: response to client (**Response Headers**, **Response Body**).
When you click a table row or choose **Select** from the row menu, the **trace detail drawer** opens on the **right** (wide drawer; horizontal scroll on narrow screens). The header shows the **HTTP method** (color badge), **path**, **HTTP status code**, and **result type** (for example SUCCESS). Use **X** to close.
## Time and flow
#### Timing breakdown
Total time (ms) and a colored bar show how time is split. Only segments with duration greater than zero are listed; labels can include **Request Parse**, **Request Policies**, **Routing**, **Response Policies**, and **Response Serialize**. Hover a segment to see its duration.
#### Flow map (Client → Gateway → API)
* Use **‹ Back** and **Next ›** to move through steps in order: **Client** → gateway ingress node → **request policies** (left to right) → gateway egress node → **API (target)** → return-from-target node → **response policies** → client egress node.
* **Click a node** to jump directly to that step.
* Successful steps show a green check; errors or blocks show **!**.
* **Skipped** policies appear faded, with an **S** badge and a tooltip that includes the skip reason.
***
### Lower panel: content for the selected step
Content is one or two columns depending on the step; sections use **accordions** (tables with **Name** / **Value**). JSON bodies appear in a read-only editor.
### Client
Left: request from client (**HTTP Info**, **Request Headers**, **Request Parameters**, **Request Body**). Right: response to client (**Response Headers**, **Response Body**).
 ### Gateway ingress (request received at gateway)
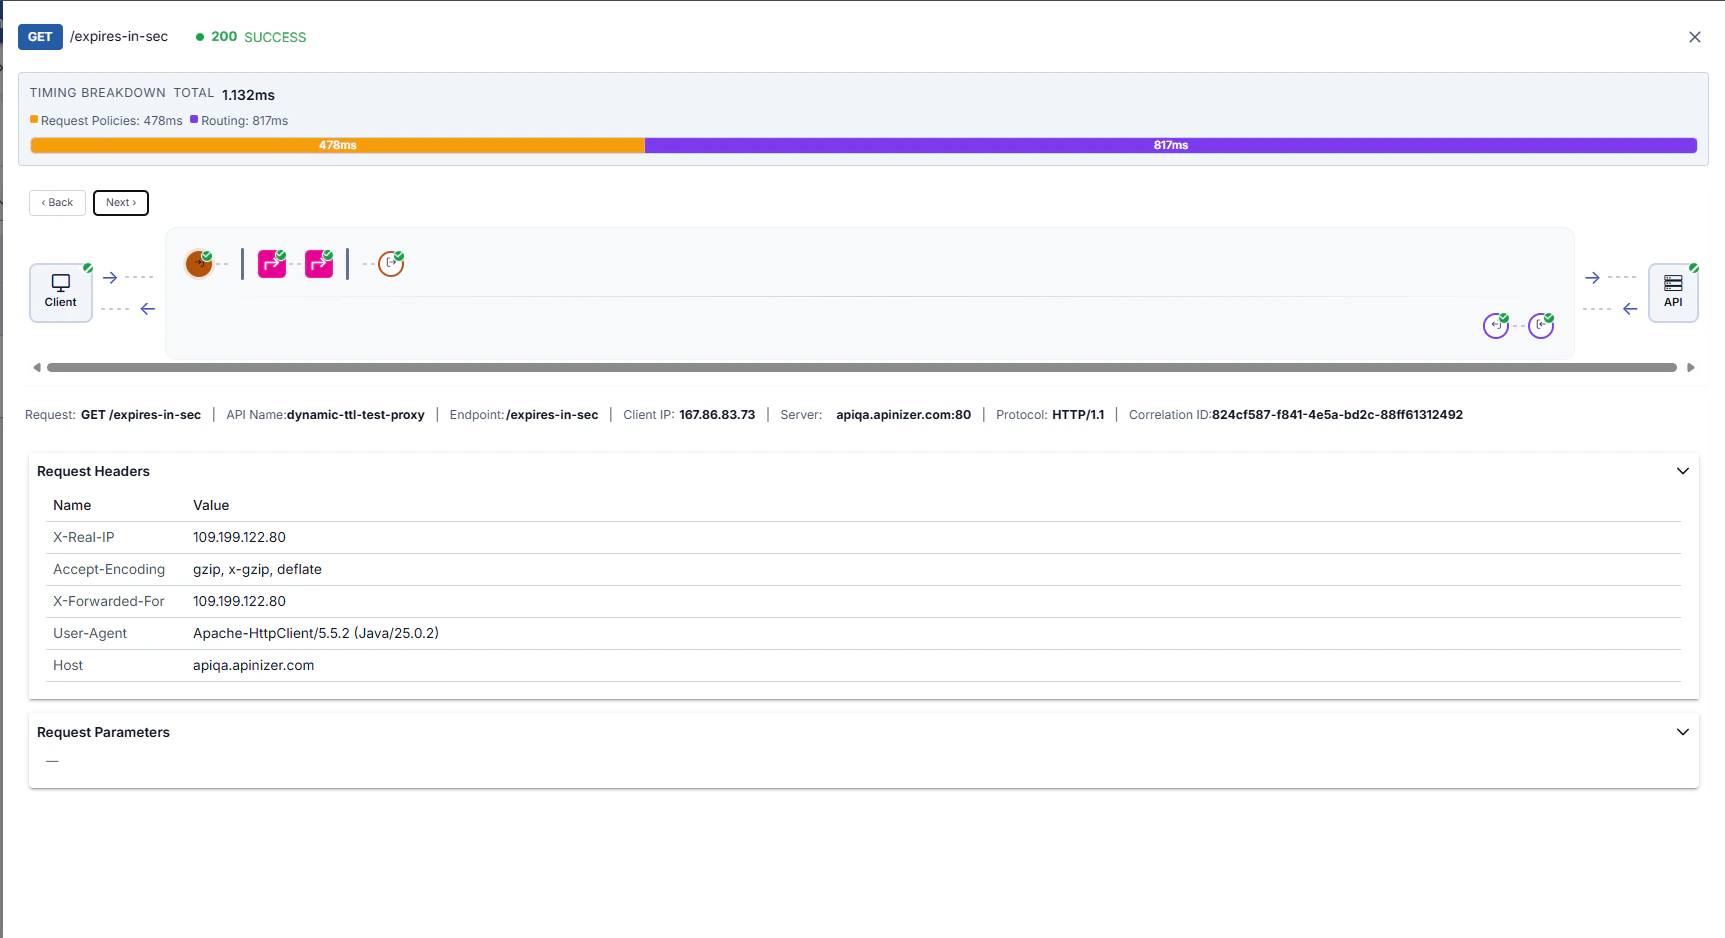
Summary line with request line, API name, endpoint, client IP, server host/port, protocol, and **Correlation ID**; below that, request headers and parameters.
### Gateway ingress (request received at gateway)
Summary line with request line, API name, endpoint, client IP, server host/port, protocol, and **Correlation ID**; below that, request headers and parameters.
 ### Request policy
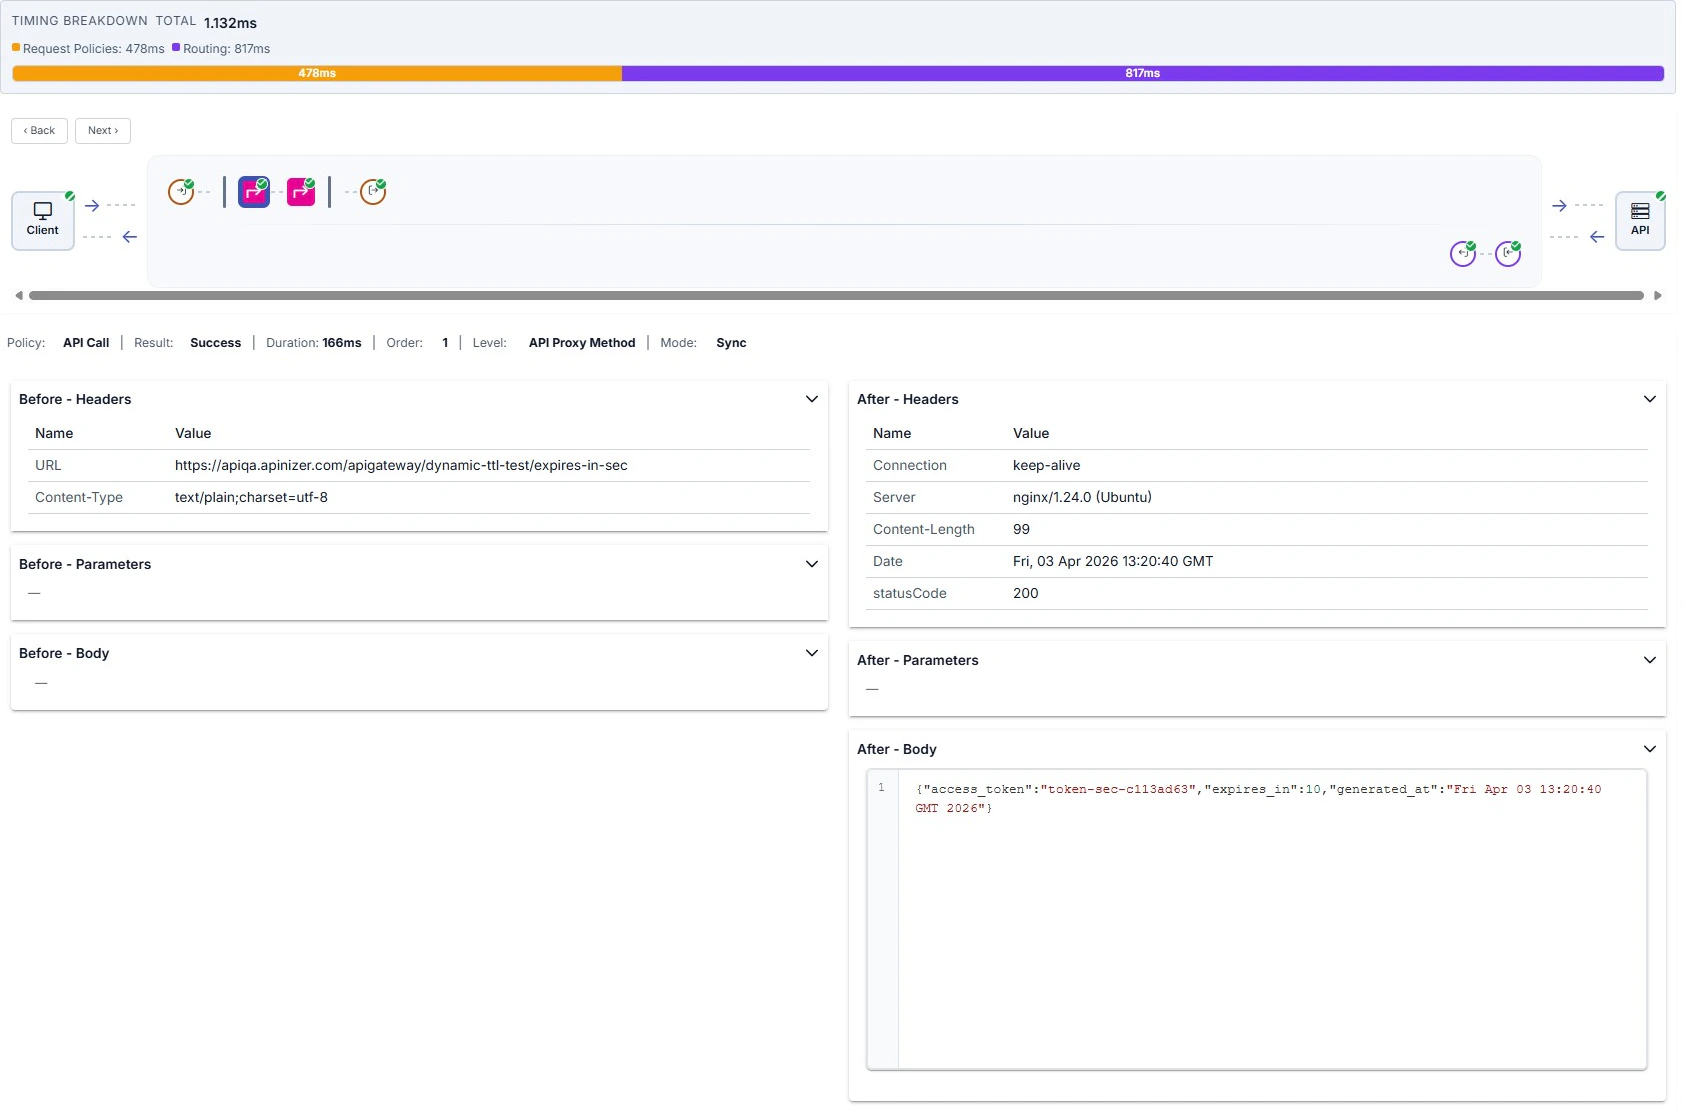
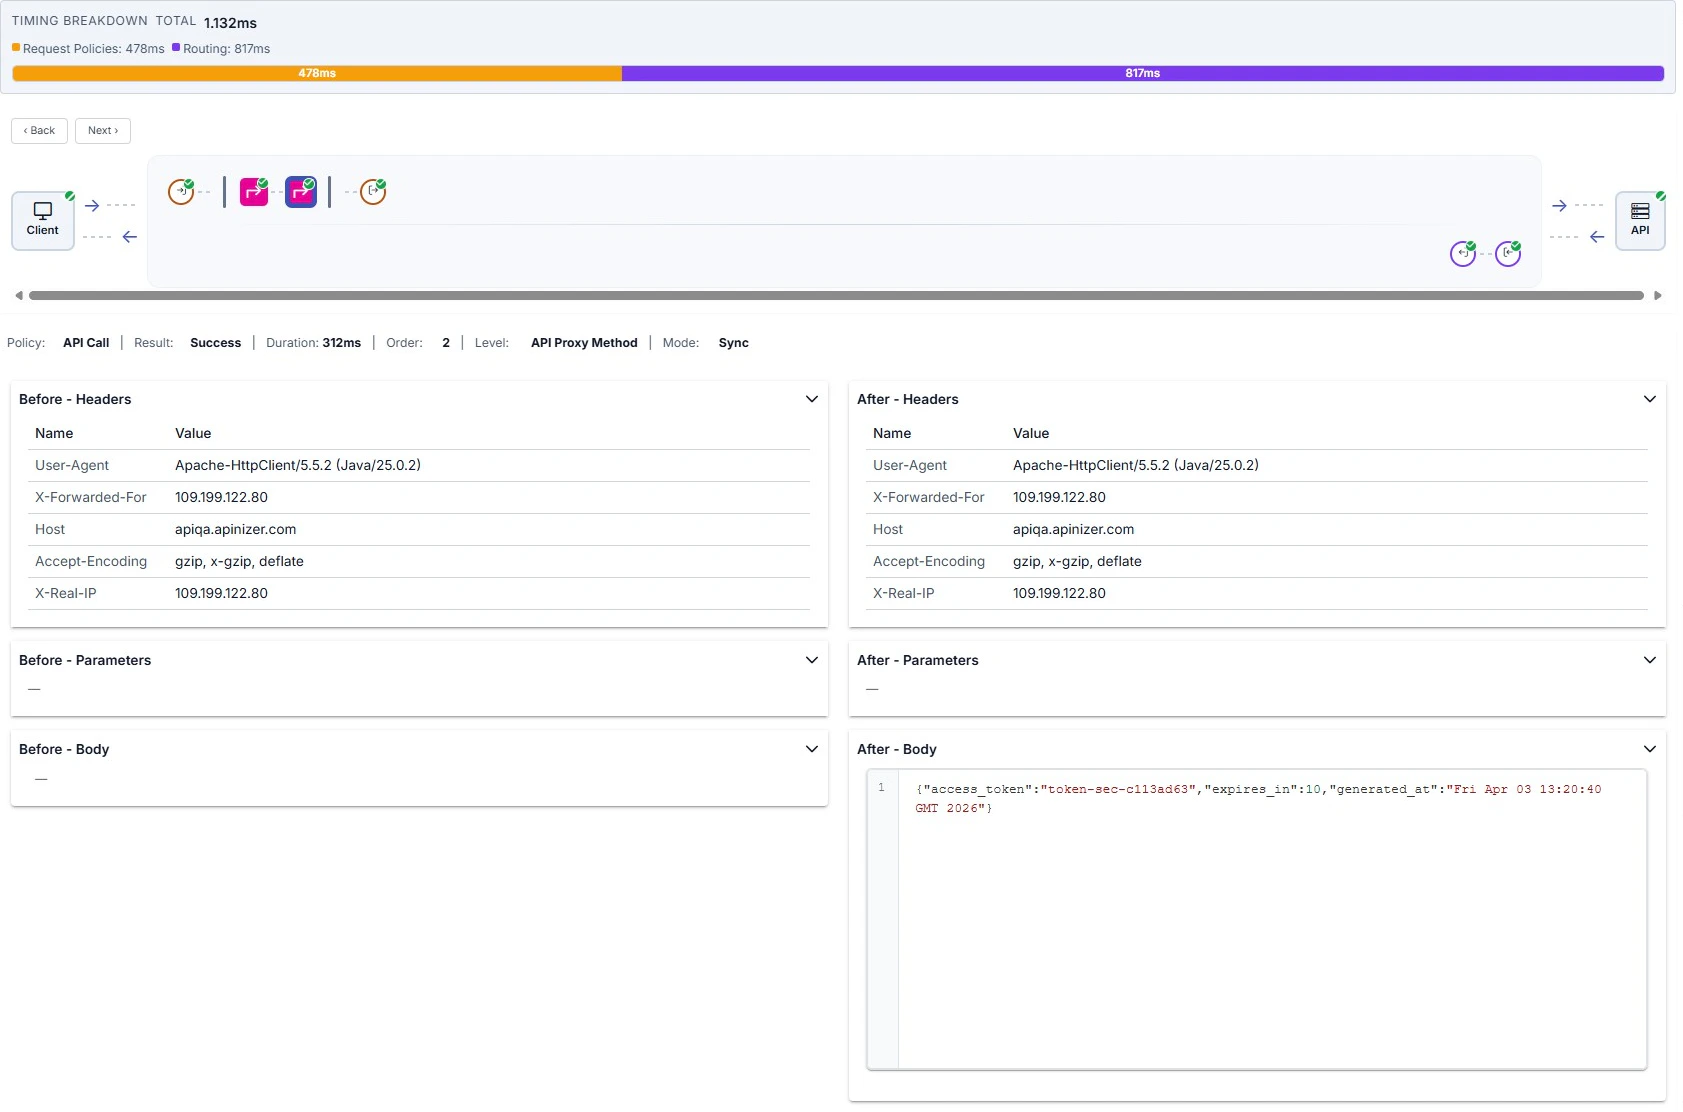
Execution strip — **Policy**, **Result**, **Duration**, **Order**, **Level**, **Mode**; if skipped, **Skip reason**. When executed: left **Before - Headers / Parameters / Body**, right **After - Headers / Parameters / Body**.
### Request policy
Execution strip — **Policy**, **Result**, **Duration**, **Order**, **Level**, **Mode**; if skipped, **Skip reason**. When executed: left **Before - Headers / Parameters / Body**, right **After - Headers / Parameters / Body**.
 ### Request toward target (pre-routing egress)
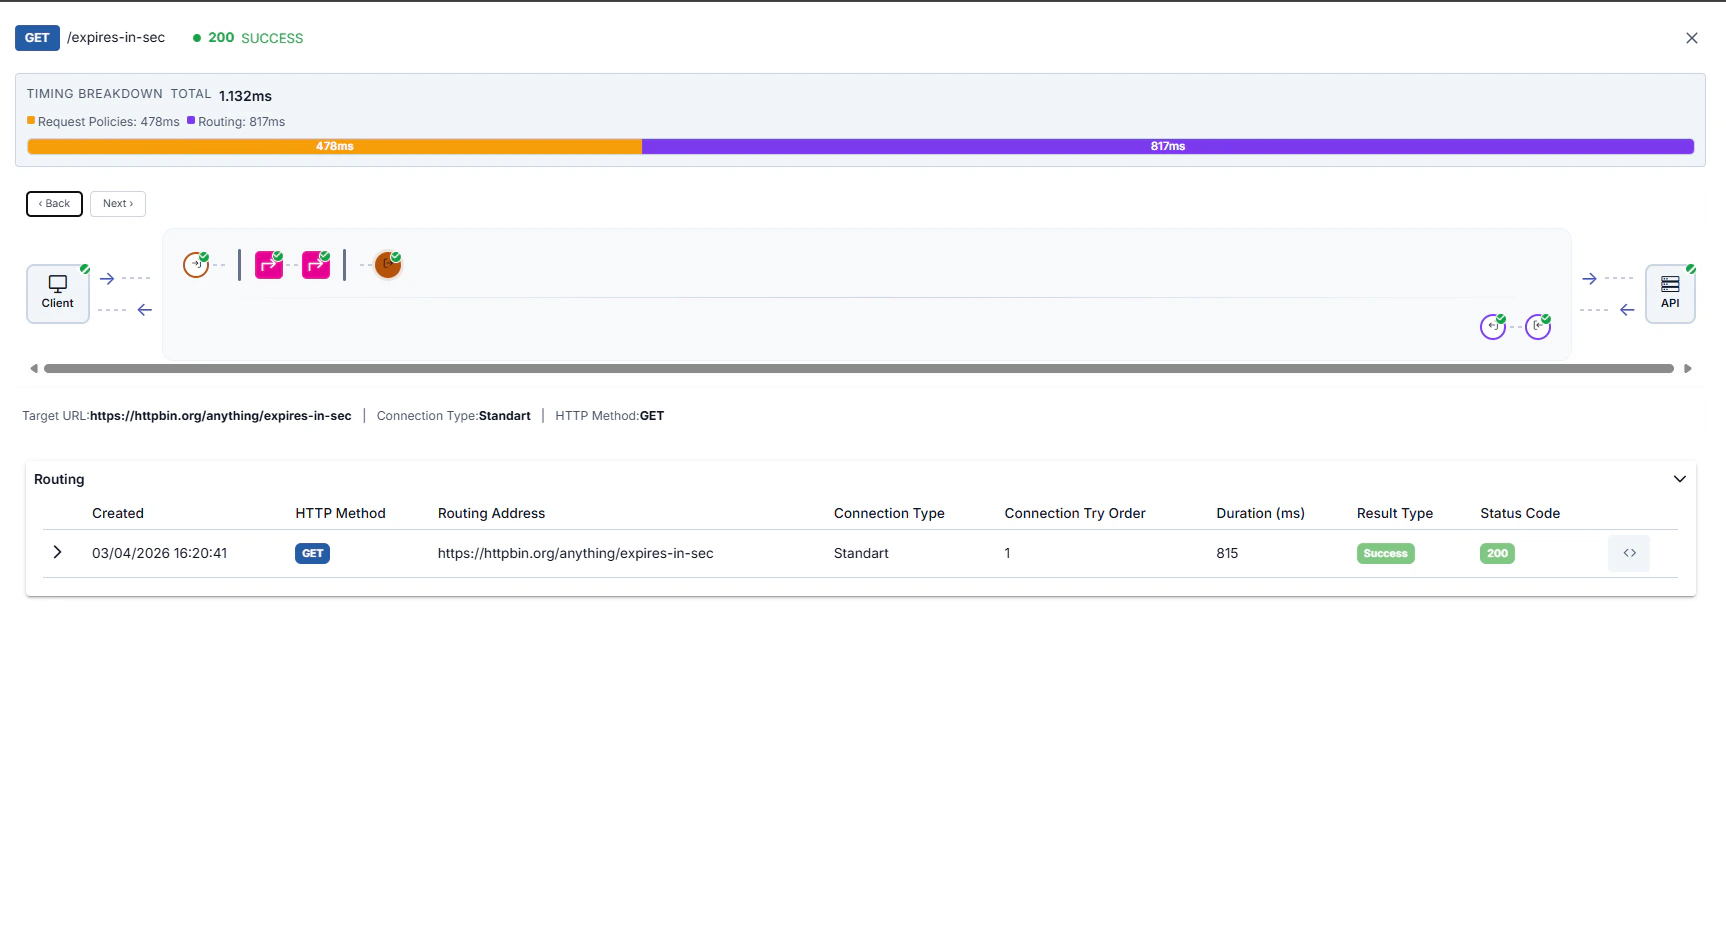
If the request never reached the backend, an informational message is shown. Otherwise **Target URL**, **Connection Type**, and **HTTP Method** appear. On this step the **Routing** accordion lists routing rows; expand a row for request/response headers and bodies; the **code** icon opens that routing record as JSON. See [HTTP routing](/en/develop/routing/http-routing) for routing options.
### Request toward target (pre-routing egress)
If the request never reached the backend, an informational message is shown. Otherwise **Target URL**, **Connection Type**, and **HTTP Method** appear. On this step the **Routing** accordion lists routing rows; expand a row for request/response headers and bodies; the **code** icon opens that routing record as JSON. See [HTTP routing](/en/develop/routing/http-routing) for routing options.
 ### Backend target (API)
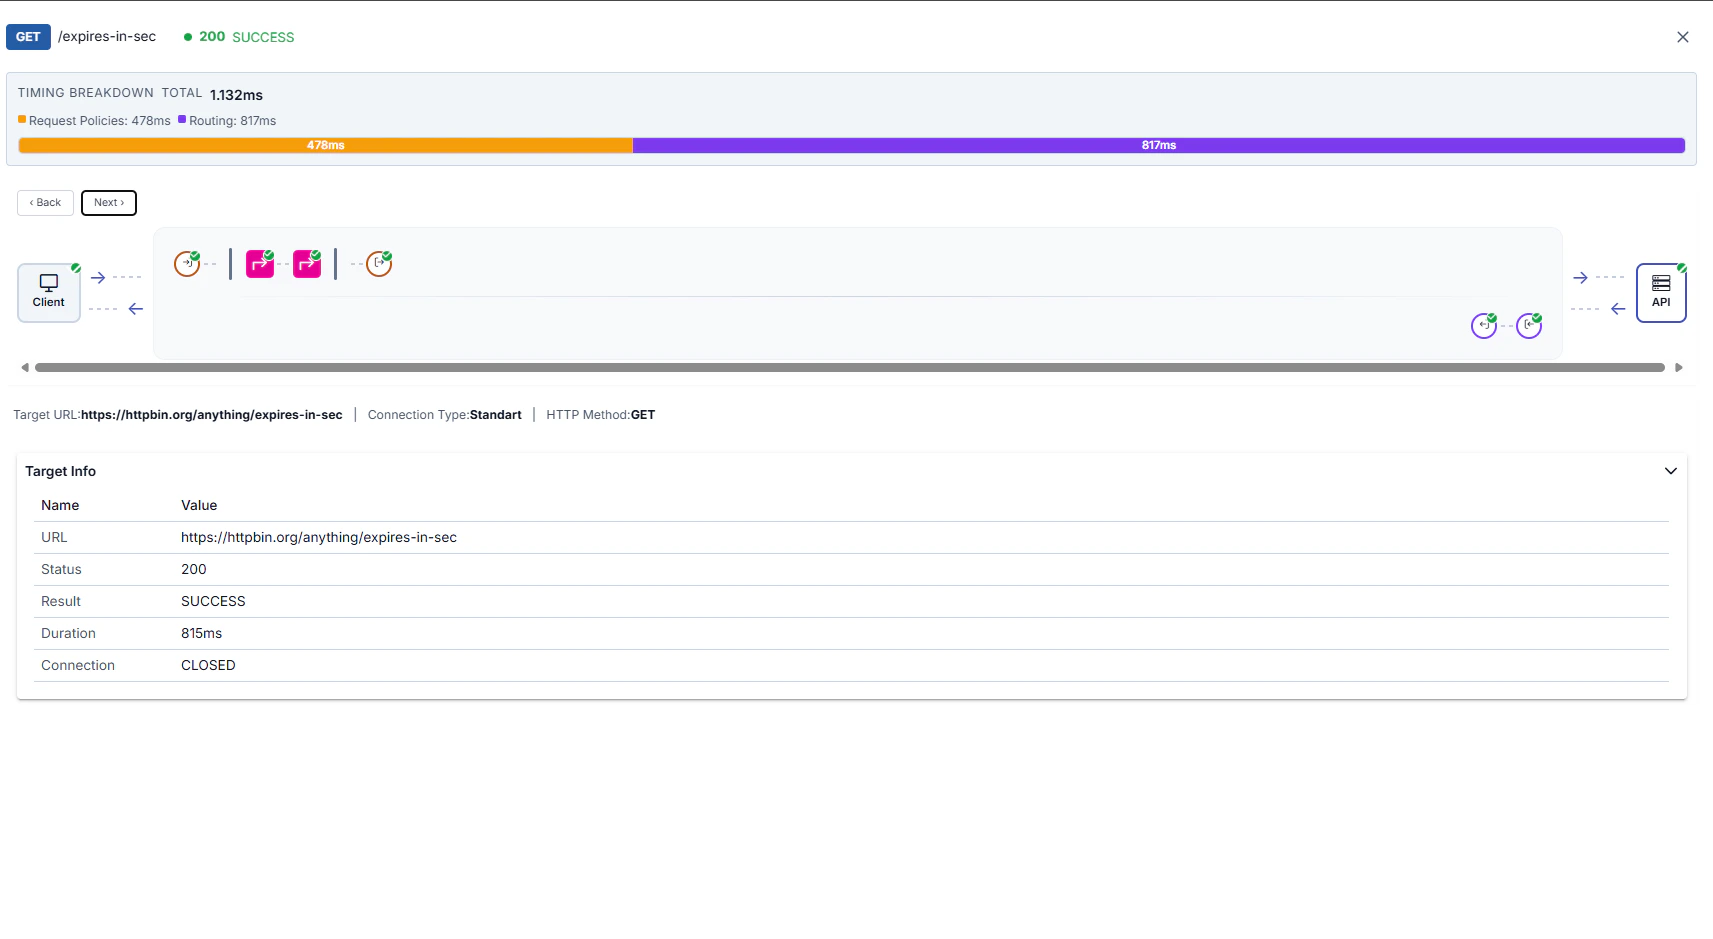
If the request did not reach the target, an explanatory message; otherwise a **Target Info** table with URL, status, result, duration, connection state, and related fields.
### Backend target (API)
If the request did not reach the target, an explanatory message; otherwise a **Target Info** table with URL, status, result, duration, connection state, and related fields.
 ### Response from target
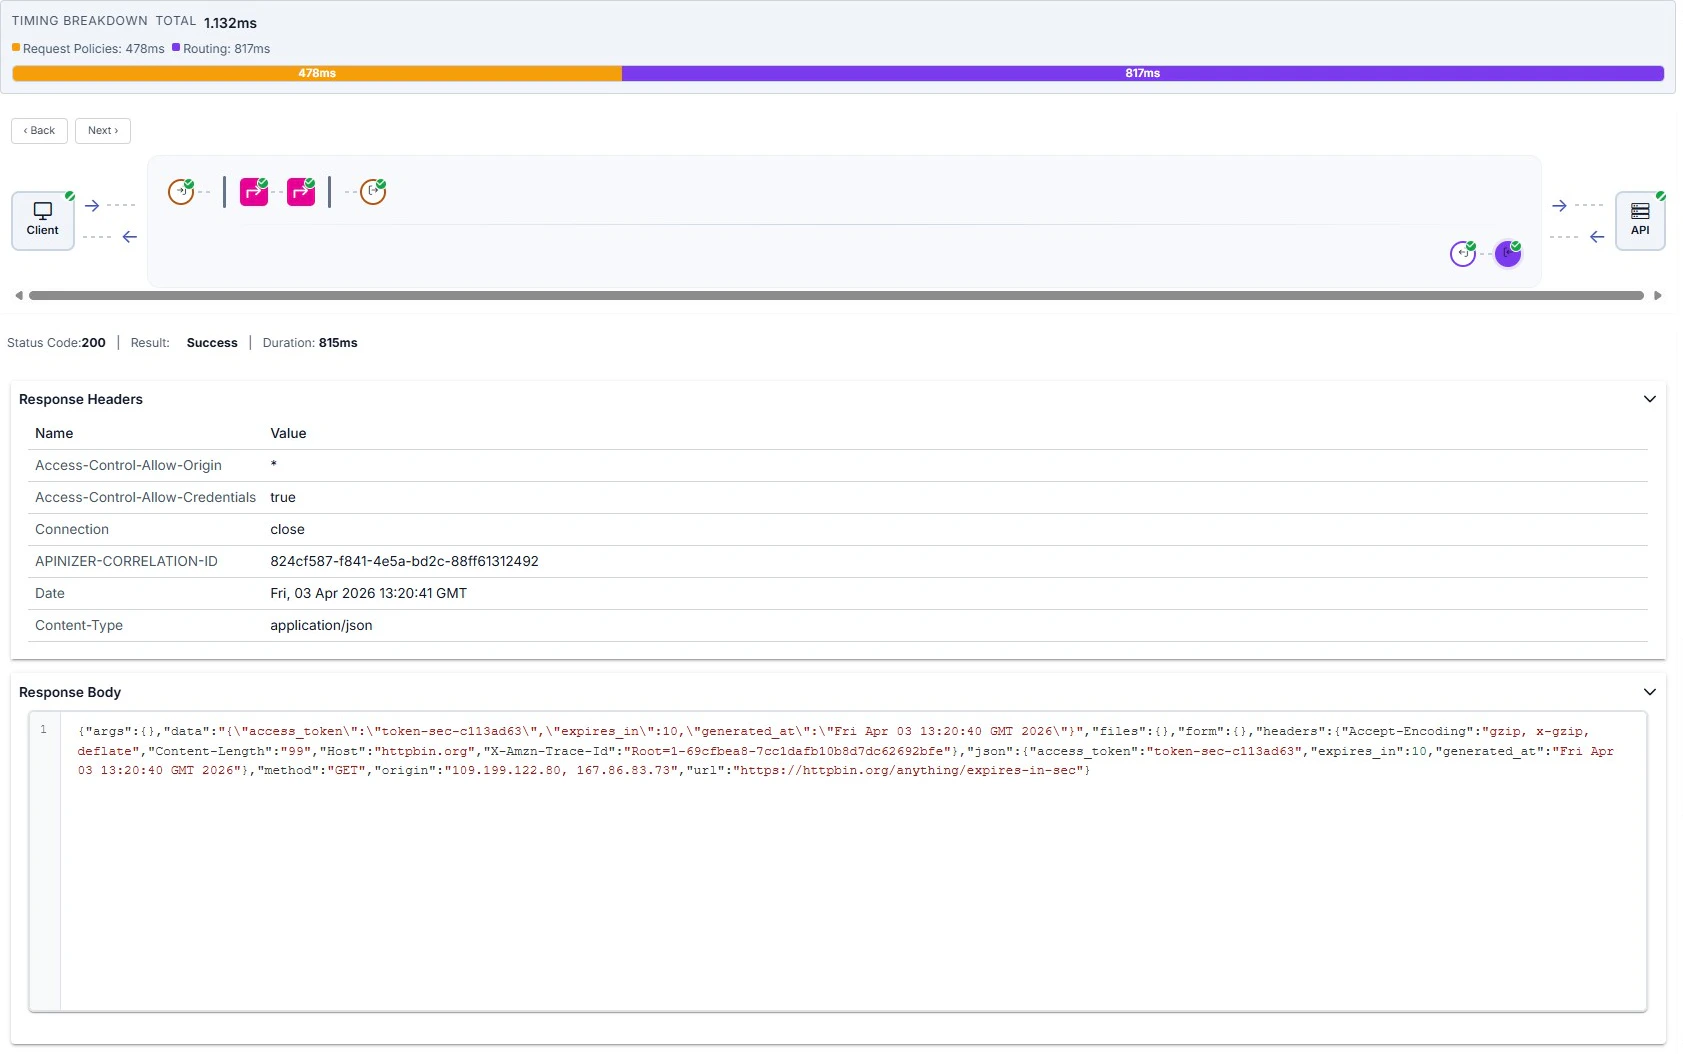
Status summary plus **Response Headers** / **Response Body**.
### Response from target
Status summary plus **Response Headers** / **Response Body**.
 ### Response sent to client
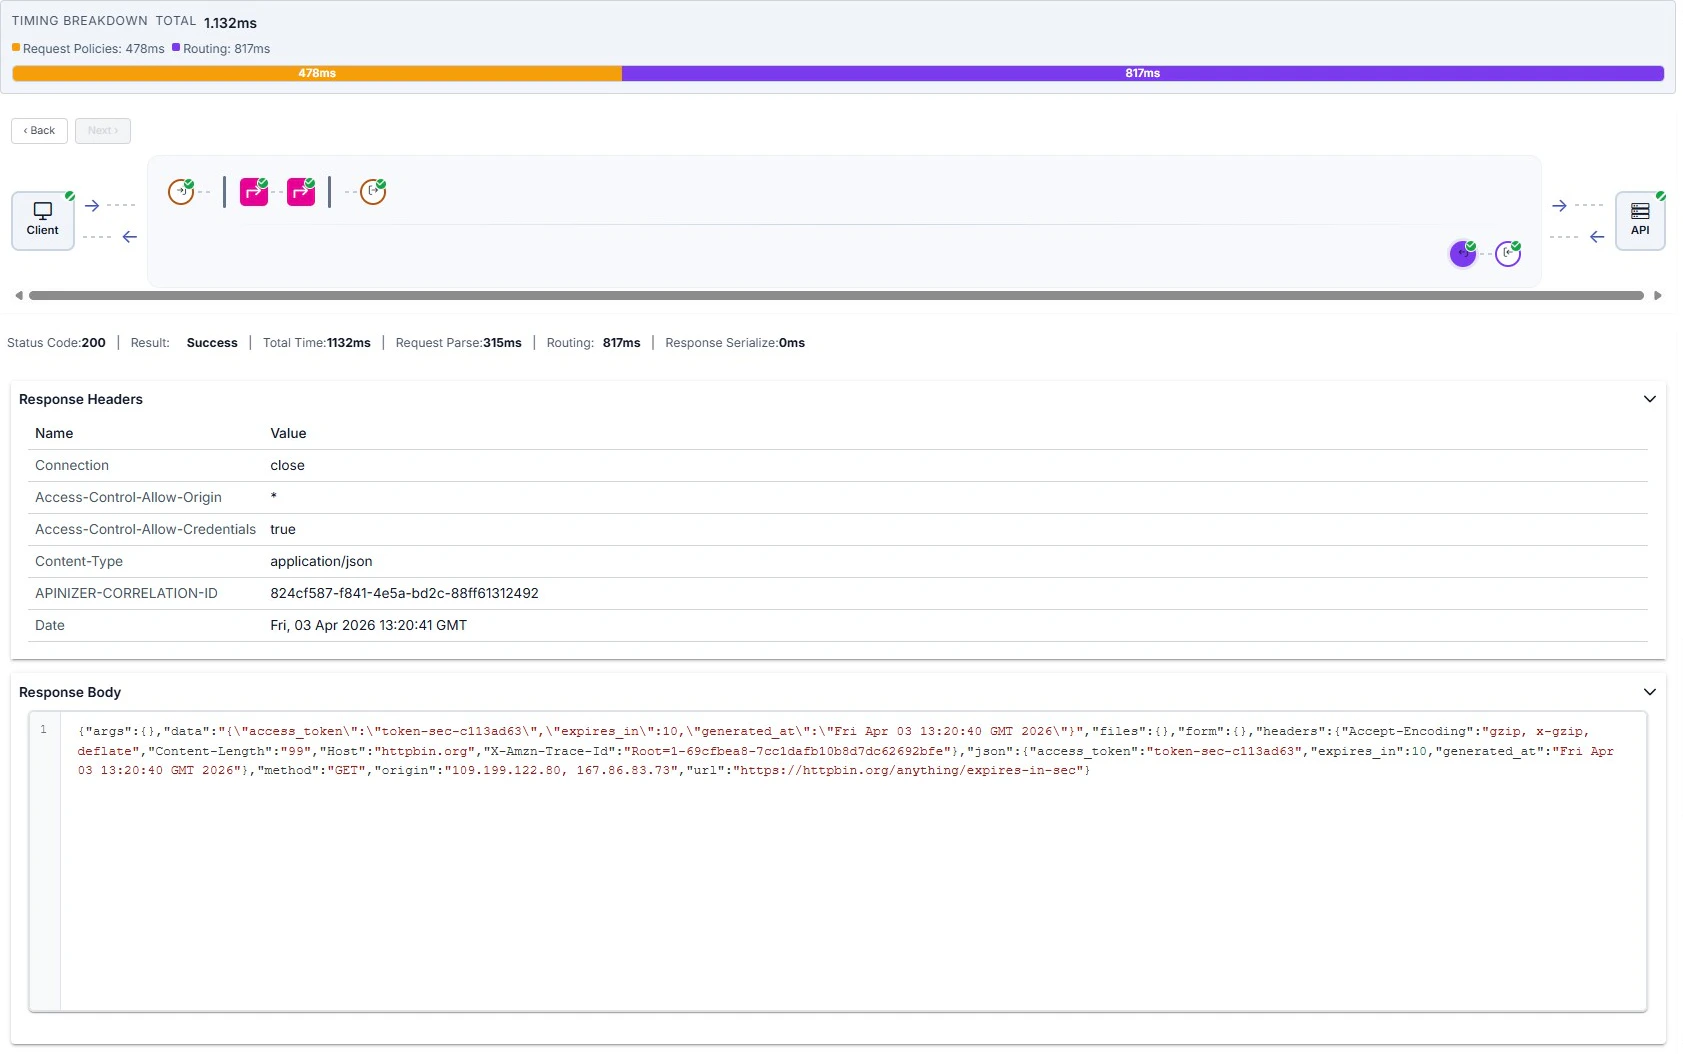
Status, result, total time, and breakdown fields such as request processing, routing, and response serialization; **Response Headers** and **Response Body**.
### Response sent to client
Status, result, total time, and breakdown fields such as request processing, routing, and response serialization; **Response Headers** and **Response Body**.
 ## Deleting trace logs
The **trash** icon in the table header deletes all trace logs stored for this API Proxy; a confirmation dialog asks you to approve.
## No environment warning
If the API Proxy is not deployed to any environment, a full-screen warning is shown; deploy to **at least one environment** before starting trace.
## Deleting trace logs
The **trash** icon in the table header deletes all trace logs stored for this API Proxy; a confirmation dialog asks you to approve.
## No environment warning
If the API Proxy is not deployed to any environment, a full-screen warning is shown; deploy to **at least one environment** before starting trace.