> ## Documentation Index
> Fetch the complete documentation index at: https://docs.apinizer.com/llms.txt
> Use this file to discover all available pages before exploring further.
# Anomaly Detector
> You can automatically detect abnormal behaviors in API traffic, monitor deviations in performance metrics, perform statistical analysis, and send notifications when anomalies are detected.
## Overview
Automatically detect abnormal situations in your API traffic
Monitor anomalies in metrics such as response time and error rate
Detect changes such as traffic increase/decrease early
Perform statistical anomaly detection with EMA algorithm
Receive instant notifications when anomalies are detected
Visualize historical anomaly data with charts
 ## What is Anomaly Detector?
### Basic Concept
Anomaly Detector is a monitoring system that automatically detects **deviations from normal behavior** in your API traffic.
**Anomaly Detection**, in its simplest sense, is a technique that enables finding unexpected situations or patterns in data. These unexpected situations or patterns are actually situations or patterns that do not conform to the expected behaviors of data. In the literature, these unexpected situations are called outliers (outlier values), exceptions (exceptional situations), or anomalies (outside the norm).
**Example Scenario:** Let's say you spend approximately 200-300 TL per month from your credit card. That is, in your bank's profile, you are a customer who makes low-budget expenditures every month. So what happens if one day you make a purchase of 1500 TL?
Actually, this situation indicates that you have deviated from your normal behavior and that you have suddenly become a customer who spends 1500 TL unexpectedly, while normally you are a customer who spends at most 200-300 TL. This situation is actually an anomaly behavior. If your bank uses anomaly detection techniques in this case, it predicts that this could be credit card fraud (Credit Card Fraud Detection) and sends you a message. This simple example is actually an anomaly detection example.
Detecting abnormal increases in response times
Detecting sudden rises in error rates
Detecting changes such as traffic increase/decrease
Detecting deviations in service level agreements
Detecting suspicious traffic behaviors
Performing capacity planning by analyzing traffic trends
Query, filter, conditions, and scheduling are determined
Analysis is performed automatically at specified times (e.g., every 5 minutes)
API traffic is analyzed using query and filter
Anomaly check is performed according to defined conditions:
* Metric Check: Did the value exceed a certain threshold?
* Rate Check: Did the value increase/decrease by a certain rate?
* EMA Check: Is the value statistically abnormal?
When an anomaly is detected, the result is saved
When an anomaly is detected, configured notifications are triggered
## Quick Start
### Creating Your First Anomaly Detector
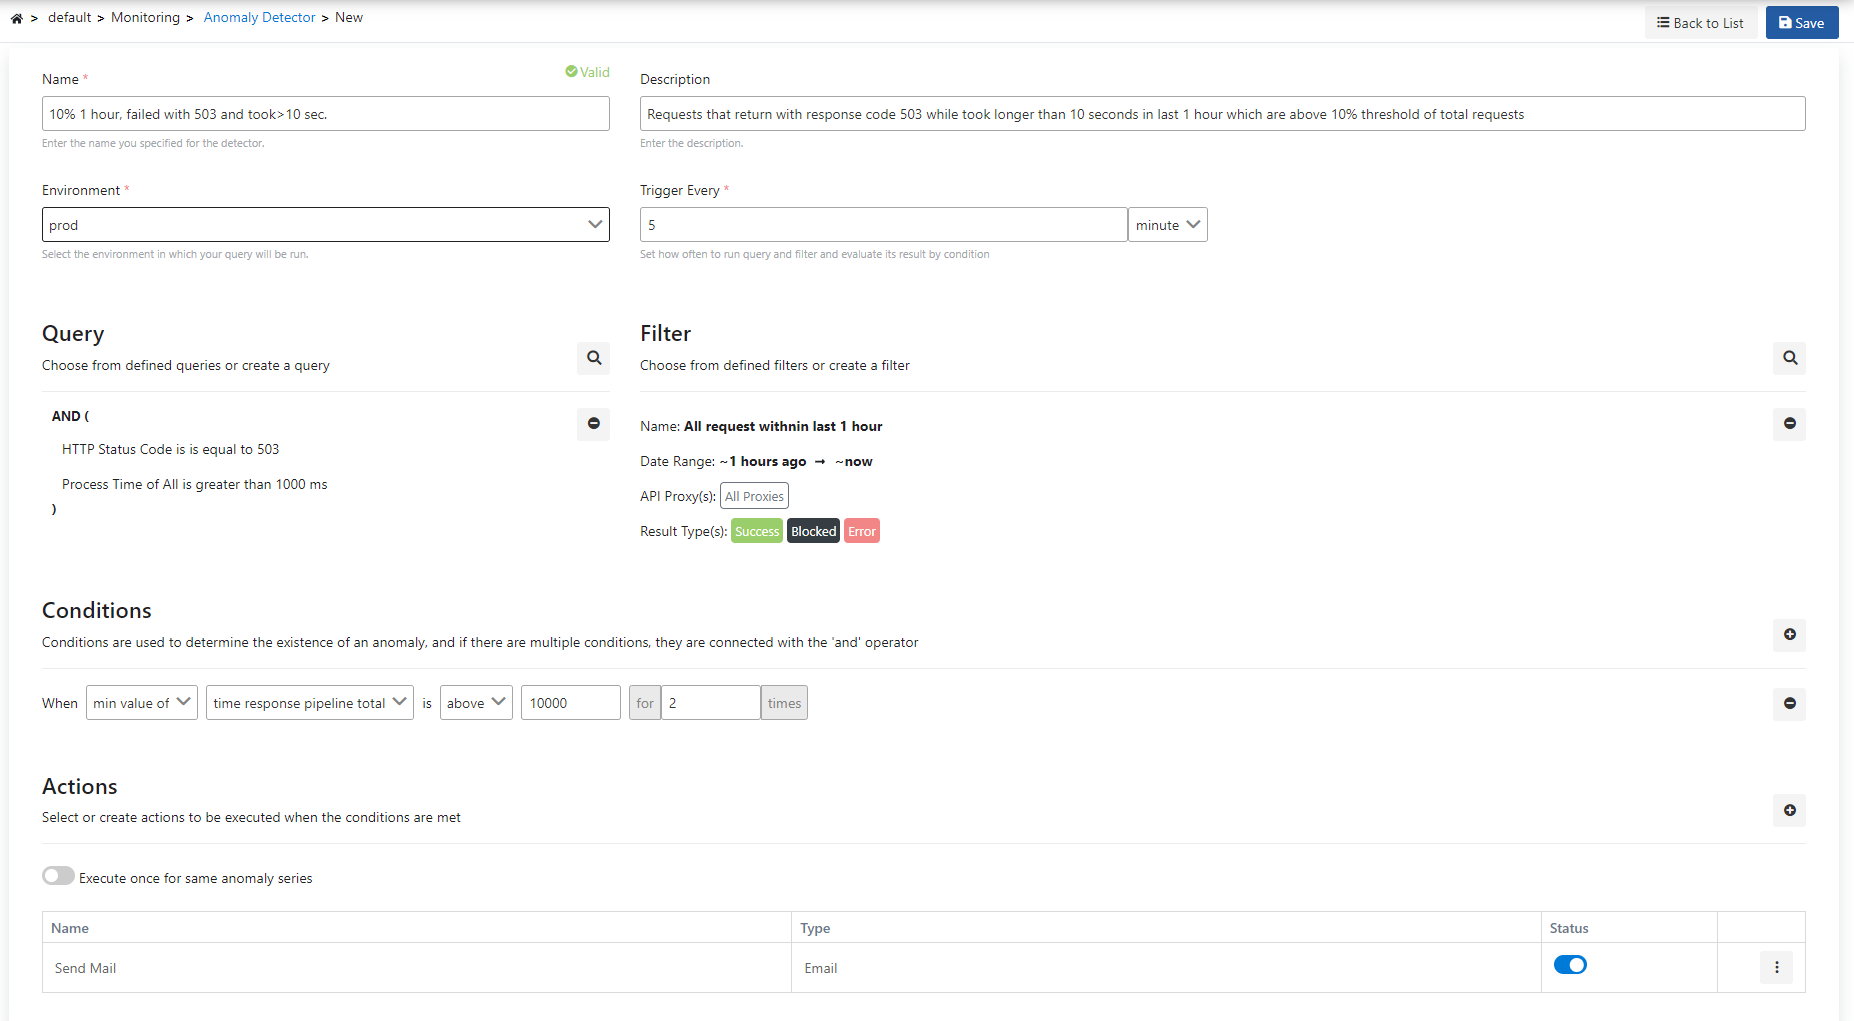
Click **Monitoring** → **Anomaly Detector** from the **Main Menu**
Click the **"Create New"** button
* **Name**: A name for your detector (e.g., "Response Time Anomaly Detection")
* **Description**: Optional description
* **Environment**: Select the environment to be analyzed
Define the API traffic to be analyzed with query and filter
Define anomaly detection conditions (Metric, Rate, or EMA)
Determine analysis frequency (e.g., Every 5 minutes)
Click the **"Save"** button
## Creating a New Anomaly Detector
### Step 1: Basic Information
Enter a unique name for the anomaly detector. This name:
* Must be unique within the project
* Cannot start with a space
* The system automatically checks the availability of the name
**Good Name Examples:**
* `Response Time Anomaly Detection`
* `Error Rate Increase Monitoring`
* `Traffic Anomaly Detector`
* `Critical API Performance Monitoring`
You can enter descriptive information about the anomaly detector:
* Maximum 500 characters
* Used to explain the purpose and scope of the detector
* Displayed on the list page
**Example Descriptions:**
* `Created for response time anomaly detection of critical payment API`
* `Used to monitor error rate increases across all APIs`
* `Uses EMA algorithm to detect traffic anomalies`
Select the environment to be analyzed:
* Select an environment from the environment list
* The selected environment must have Elasticsearch integration active
* Environments without integration are shown as disabled
Determines the active/passive status of the detector:
* **Active**: Detector runs, scheduled analyses are performed
* **Passive**: Detector is stopped, no analysis is performed (historical data is preserved)
### Step 2: Scheduling Settings
Determine how often the detector will run. Scheduling is done using **Cron Expression**.
#### Common Scheduling Examples
| Description | Cron Expression | Use Case |
| ------------------ | ---------------- | --------------------------------- |
| Every 5 minutes | `0 */5 * ? * *` | For critical APIs (most common) |
| Every 15 minutes | `0 */15 * ? * *` | For normal APIs |
| Every hour | `0 0 * ? * *` | For test/development environments |
| Every day at 09:00 | `0 0 9 * ? *` | For daily reporting |
**Recommendations:**
* **For critical APIs**: Every 5 minutes
* **For normal APIs**: Every 15-30 minutes
* **For test/development**: Every hour
### Step 3: Query and Filter Configuration
In this section, you define the API traffic to be analyzed.
Query defines the API traffic to be analyzed:
Click the **"Select or Create Query"** button
In the opened dialog:
* You can select an existing query OR
* Create a new query
* **API Proxy**: Which APIs will be analyzed?
* **HTTP Method**: Which HTTP methods will be analyzed?
* **Endpoint**: Which endpoints will be analyzed?
* And more...
**Query Examples:**
* Analyze all failed requests
* Analyze all requests of a specific API proxy
* Analyze response times of a specific endpoint
For detailed information about queries, see the [Queries](/en/analytic/query-editor/queries) page.
Filter is used to further narrow down query results:
Click the **"Select or Create Filter"** button
In the opened dialog:
* You can select an existing filter OR
* Create a new filter
* **Date Range**: Which time range will be analyzed?
* **Proxy List**: Which proxies will be included?
* **Result Type**: Successful/Failed/Blocked requests
**Filter Examples:**
* Analyze traffic from the last 1 hour
* Analyze only failed requests
* Exclude specific proxies
For detailed information about filters, see the [Filters](/en/analytic/query-editor/filters) page.
### Step 4: Condition Definition
Conditions are the criteria used for anomaly detection. You can define multiple conditions. An anomaly is detected when **at least one condition** is met.
#### Condition Types
Anomaly Detector supports 4 different types of conditions:
Direct check of metric values - Did the value exceed a certain threshold?
Metric increase/decrease rate check - Did the value increase/decrease by a certain rate?
Use of EMA with bollinger bands - Is the value statistically abnormal?
Query/Filter rate check - Ratio of query results to filter results
#### Adding Conditions
1. Click the **"+"** button to add a new condition
2. Select the condition type (Metric / Rate / EMA / Query - Filter Rate)
3. Fill in the condition parameters
Metric condition checks whether a metric value exceeds a certain threshold.
## What is Anomaly Detector?
### Basic Concept
Anomaly Detector is a monitoring system that automatically detects **deviations from normal behavior** in your API traffic.
**Anomaly Detection**, in its simplest sense, is a technique that enables finding unexpected situations or patterns in data. These unexpected situations or patterns are actually situations or patterns that do not conform to the expected behaviors of data. In the literature, these unexpected situations are called outliers (outlier values), exceptions (exceptional situations), or anomalies (outside the norm).
**Example Scenario:** Let's say you spend approximately 200-300 TL per month from your credit card. That is, in your bank's profile, you are a customer who makes low-budget expenditures every month. So what happens if one day you make a purchase of 1500 TL?
Actually, this situation indicates that you have deviated from your normal behavior and that you have suddenly become a customer who spends 1500 TL unexpectedly, while normally you are a customer who spends at most 200-300 TL. This situation is actually an anomaly behavior. If your bank uses anomaly detection techniques in this case, it predicts that this could be credit card fraud (Credit Card Fraud Detection) and sends you a message. This simple example is actually an anomaly detection example.
Detecting abnormal increases in response times
Detecting sudden rises in error rates
Detecting changes such as traffic increase/decrease
Detecting deviations in service level agreements
Detecting suspicious traffic behaviors
Performing capacity planning by analyzing traffic trends
Query, filter, conditions, and scheduling are determined
Analysis is performed automatically at specified times (e.g., every 5 minutes)
API traffic is analyzed using query and filter
Anomaly check is performed according to defined conditions:
* Metric Check: Did the value exceed a certain threshold?
* Rate Check: Did the value increase/decrease by a certain rate?
* EMA Check: Is the value statistically abnormal?
When an anomaly is detected, the result is saved
When an anomaly is detected, configured notifications are triggered
## Quick Start
### Creating Your First Anomaly Detector
Click **Monitoring** → **Anomaly Detector** from the **Main Menu**
Click the **"Create New"** button
* **Name**: A name for your detector (e.g., "Response Time Anomaly Detection")
* **Description**: Optional description
* **Environment**: Select the environment to be analyzed
Define the API traffic to be analyzed with query and filter
Define anomaly detection conditions (Metric, Rate, or EMA)
Determine analysis frequency (e.g., Every 5 minutes)
Click the **"Save"** button
## Creating a New Anomaly Detector
### Step 1: Basic Information
Enter a unique name for the anomaly detector. This name:
* Must be unique within the project
* Cannot start with a space
* The system automatically checks the availability of the name
**Good Name Examples:**
* `Response Time Anomaly Detection`
* `Error Rate Increase Monitoring`
* `Traffic Anomaly Detector`
* `Critical API Performance Monitoring`
You can enter descriptive information about the anomaly detector:
* Maximum 500 characters
* Used to explain the purpose and scope of the detector
* Displayed on the list page
**Example Descriptions:**
* `Created for response time anomaly detection of critical payment API`
* `Used to monitor error rate increases across all APIs`
* `Uses EMA algorithm to detect traffic anomalies`
Select the environment to be analyzed:
* Select an environment from the environment list
* The selected environment must have Elasticsearch integration active
* Environments without integration are shown as disabled
Determines the active/passive status of the detector:
* **Active**: Detector runs, scheduled analyses are performed
* **Passive**: Detector is stopped, no analysis is performed (historical data is preserved)
### Step 2: Scheduling Settings
Determine how often the detector will run. Scheduling is done using **Cron Expression**.
#### Common Scheduling Examples
| Description | Cron Expression | Use Case |
| ------------------ | ---------------- | --------------------------------- |
| Every 5 minutes | `0 */5 * ? * *` | For critical APIs (most common) |
| Every 15 minutes | `0 */15 * ? * *` | For normal APIs |
| Every hour | `0 0 * ? * *` | For test/development environments |
| Every day at 09:00 | `0 0 9 * ? *` | For daily reporting |
**Recommendations:**
* **For critical APIs**: Every 5 minutes
* **For normal APIs**: Every 15-30 minutes
* **For test/development**: Every hour
### Step 3: Query and Filter Configuration
In this section, you define the API traffic to be analyzed.
Query defines the API traffic to be analyzed:
Click the **"Select or Create Query"** button
In the opened dialog:
* You can select an existing query OR
* Create a new query
* **API Proxy**: Which APIs will be analyzed?
* **HTTP Method**: Which HTTP methods will be analyzed?
* **Endpoint**: Which endpoints will be analyzed?
* And more...
**Query Examples:**
* Analyze all failed requests
* Analyze all requests of a specific API proxy
* Analyze response times of a specific endpoint
For detailed information about queries, see the [Queries](/en/analytic/query-editor/queries) page.
Filter is used to further narrow down query results:
Click the **"Select or Create Filter"** button
In the opened dialog:
* You can select an existing filter OR
* Create a new filter
* **Date Range**: Which time range will be analyzed?
* **Proxy List**: Which proxies will be included?
* **Result Type**: Successful/Failed/Blocked requests
**Filter Examples:**
* Analyze traffic from the last 1 hour
* Analyze only failed requests
* Exclude specific proxies
For detailed information about filters, see the [Filters](/en/analytic/query-editor/filters) page.
### Step 4: Condition Definition
Conditions are the criteria used for anomaly detection. You can define multiple conditions. An anomaly is detected when **at least one condition** is met.
#### Condition Types
Anomaly Detector supports 4 different types of conditions:
Direct check of metric values - Did the value exceed a certain threshold?
Metric increase/decrease rate check - Did the value increase/decrease by a certain rate?
Use of EMA with bollinger bands - Is the value statistically abnormal?
Query/Filter rate check - Ratio of query results to filter results
#### Adding Conditions
1. Click the **"+"** button to add a new condition
2. Select the condition type (Metric / Rate / EMA / Query - Filter Rate)
3. Fill in the condition parameters
Metric condition checks whether a metric value exceeds a certain threshold.
 **Configuration Fields:**
| Field | Description |
| ------------------------ | ---------------------------------------------------------------------------------------------------------------------- |
| **average of** | Indicates which operation will be applied to the value in the next column. In this example, average value is selected. |
| **time api proxy total** | Specifies which metric field will be processed. In this example, API Proxy total time is selected. |
| **above** | Specifies how the found metric will be compared with the next value. |
| **for ... times** | Specifies that this condition must be met for the last ... times. |
**Supported Operators:**
* **Above**: `Value > Threshold`
* **Above or Equal**: `Value >= Threshold`
* **Below**: `Value < Threshold`
* **Below or Equal**: `Value <= Threshold`
* **Between**: `Threshold1 < Value < Threshold2`
**Example Scenario:**
* Metric Type: Average Response Time
* Operator: Above
* Threshold Value: 1000 ms
* Repeat Count: 3
* **Meaning**: Anomaly is detected when average response time exceeds 1000 ms and this situation is repeated 3 times.
Rate condition checks whether a metric value increases or decreases by a certain rate.
**Configuration Fields:**
| Field | Description |
| ------------------------ | ---------------------------------------------------------------------------------------------------------------------- |
| **average of** | Indicates which operation will be applied to the value in the next column. In this example, average value is selected. |
| **time api proxy total** | Specifies which metric field will be processed. In this example, API Proxy total time is selected. |
| **above** | Specifies how the found metric will be compared with the next value. |
| **for ... times** | Specifies that this condition must be met for the last ... times. |
**Supported Operators:**
* **Above**: `Value > Threshold`
* **Above or Equal**: `Value >= Threshold`
* **Below**: `Value < Threshold`
* **Below or Equal**: `Value <= Threshold`
* **Between**: `Threshold1 < Value < Threshold2`
**Example Scenario:**
* Metric Type: Average Response Time
* Operator: Above
* Threshold Value: 1000 ms
* Repeat Count: 3
* **Meaning**: Anomaly is detected when average response time exceeds 1000 ms and this situation is repeated 3 times.
Rate condition checks whether a metric value increases or decreases by a certain rate.
 **Configuration Fields:**
| Field | Description |
| ------------------------ | --------------------------------------------------------------------------------------------------------------------------------------------------------------- |
| **average of** | Indicates which operation will be applied to the value in the next column. In this example, average value is selected. |
| **time api proxy total** | Specifies which metric field will be processed. In this example, API Proxy total time is selected. |
| **increased by** | Specifies what the behavior of the found metric will be. In this example, increase rate is selected. |
| **more than** | Specifies how the metric behavior will be compared with the previous value. In this example, greater than comparison is selected. |
| **average** | Specifies how the last values to be checked will be handled. In this example, it specifies that the "Average" of the last values to be checked should be taken. |
| **previous ... result** | Specifies that this condition must be met for the last ... times. |
**How Does It Work?**
* Previous N results are compared with current result
* Increase/decrease rate is calculated
* This rate is compared with threshold value
**Example Scenario:**
* Metric Type: Total Request Count
* Operator: Increase Rate
* Rate Operator: Above
* Threshold Value: 50%
* Previous Result Count: 5
* **Meaning**: Anomaly is detected when total request count increases by more than 50% compared to the last 5 analysis results.
EMA (Exponential Moving Average) condition detects statistically abnormal values.
**Configuration Fields:**
| Field | Description |
| ------------------------ | --------------------------------------------------------------------------------------------------------------------------------------------------------------- |
| **average of** | Indicates which operation will be applied to the value in the next column. In this example, average value is selected. |
| **time api proxy total** | Specifies which metric field will be processed. In this example, API Proxy total time is selected. |
| **increased by** | Specifies what the behavior of the found metric will be. In this example, increase rate is selected. |
| **more than** | Specifies how the metric behavior will be compared with the previous value. In this example, greater than comparison is selected. |
| **average** | Specifies how the last values to be checked will be handled. In this example, it specifies that the "Average" of the last values to be checked should be taken. |
| **previous ... result** | Specifies that this condition must be met for the last ... times. |
**How Does It Work?**
* Previous N results are compared with current result
* Increase/decrease rate is calculated
* This rate is compared with threshold value
**Example Scenario:**
* Metric Type: Total Request Count
* Operator: Increase Rate
* Rate Operator: Above
* Threshold Value: 50%
* Previous Result Count: 5
* **Meaning**: Anomaly is detected when total request count increases by more than 50% compared to the last 5 analysis results.
EMA (Exponential Moving Average) condition detects statistically abnormal values.
 **Configuration Fields:**
| Field | Description |
| ---------------------------------------------------------------- | ----------------------------------------------------------------------------------------------------------------------------------------------- |
| **average of** | Indicates which operation will be applied to the value in the next column. In this example, average value is selected. |
| **time api proxy total** | Specifies which metric field will be processed. In this example, API Proxy total time is selected. |
| **EMA** | Specifies what operation will be performed with the selected metric value. In this example, EMA value is selected. |
| **above from upper bollinger band** | Specifies how the result of the applied EMA formula will be applied. In this example, values above the Upper Bollinger Band value are selected. |
| **is calculated with** | Specifies how many previous values the EMA value will be calculated over. In this example, 10 values are selected. |
| **data points and standard deviation multiplier sensitivity of** | Specifies the sensitivity degree of EMA bollinger bands. |
**How Does EMA Work?**
* EMA calculates an average value based on historical data
* Upper and lower bands are created using standard deviation
* Anomaly is detected when current value goes outside these bands
**Sensitivity Levels:**
* **High Sensitivity (0.5-1.0)**: Detects more anomalies (more sensitive)
* **Medium Sensitivity (1.0-1.5)**: Balanced anomaly detection (recommended)
* **Low Sensitivity (1.5-2.0)**: Detects fewer anomalies (less sensitive)
**Example Scenario:**
* Metric Type: Average Response Time
* EMA Operator: Outside
* Data Point Count: 20
* EMA Sensitivity: 1.5
* **Meaning**: Response times that go outside the upper or lower bands of the EMA value calculated based on the last 20 analysis results are detected as anomalies.
Query/Filter rate check checks the ratio of query results to filter results.
**Configuration Fields:**
| Field | Description |
| ---------------------------------------------------------------- | ----------------------------------------------------------------------------------------------------------------------------------------------- |
| **average of** | Indicates which operation will be applied to the value in the next column. In this example, average value is selected. |
| **time api proxy total** | Specifies which metric field will be processed. In this example, API Proxy total time is selected. |
| **EMA** | Specifies what operation will be performed with the selected metric value. In this example, EMA value is selected. |
| **above from upper bollinger band** | Specifies how the result of the applied EMA formula will be applied. In this example, values above the Upper Bollinger Band value are selected. |
| **is calculated with** | Specifies how many previous values the EMA value will be calculated over. In this example, 10 values are selected. |
| **data points and standard deviation multiplier sensitivity of** | Specifies the sensitivity degree of EMA bollinger bands. |
**How Does EMA Work?**
* EMA calculates an average value based on historical data
* Upper and lower bands are created using standard deviation
* Anomaly is detected when current value goes outside these bands
**Sensitivity Levels:**
* **High Sensitivity (0.5-1.0)**: Detects more anomalies (more sensitive)
* **Medium Sensitivity (1.0-1.5)**: Balanced anomaly detection (recommended)
* **Low Sensitivity (1.5-2.0)**: Detects fewer anomalies (less sensitive)
**Example Scenario:**
* Metric Type: Average Response Time
* EMA Operator: Outside
* Data Point Count: 20
* EMA Sensitivity: 1.5
* **Meaning**: Response times that go outside the upper or lower bands of the EMA value calculated based on the last 20 analysis results are detected as anomalies.
Query/Filter rate check checks the ratio of query results to filter results.
 **Configuration Fields:**
| Field | Description |
| ----------------------------- | ------------------------------------------------------------------------------------------------------------------------------ |
| **query/filter rate percent** | Enables expressing the ratio of only the filter result to the query result in the filter and query at runtime as a percentage. |
| **above** | Specifies how the found metric will be compared with the next value. |
| **90** | Specifies the value to be compared with the metric. |
| **for ... time** | Specifies that this condition must be met for the last ... times. |
**Example Scenario:**
* Query/Filter Rate: 90%
* Operator: Above
* Repeat Count: 3
* **Meaning**: Anomaly is detected when the ratio of query results to filter results exceeds 90% and this situation is repeated 3 times.
### Step 5: Action Configuration
Configure actions to be triggered when an anomaly is detected:
Click the **"Select Action"** button
Supported action types:
* **Email**: Sends email notification
* **API Call**: Sends HTTP POST request
* **Webhook**: Sends notification to webhook endpoint
* And more...
Fill in the necessary information according to the action type
For detailed information about actions, see the [Connectors](/en/integrations/connectors/overview) page.
### Step 6: Saving
After filling in all information:
1. Make sure form validations pass:
* ✅ Name entered and available
* ✅ Environment selected
* ✅ Query defined
* ✅ At least one condition defined
* ✅ Scheduling settings configured
2. Click the **"Save"** button
3. After the detector is saved, you are automatically redirected to the listing page
## Monitoring and Reporting Results
### Accessing Results Page
1. Click the detector name in the detector list OR
2. Select **"Results"** option from the operations menu (⋮)
### Results Page Sections
Table showing detailed results of each analysis run:
**Columns:**
* **Date/Time**: Date and time when the analysis run was performed
* **Condition Results**: Result of each condition:
* 🟢 **Not Met (NOT MET)**: Condition not met (normal)
* 🔴 **Met (MET)**: Condition met (anomaly detected)
* 🟠 **Error (ERROR)**: Error occurred during analysis
* **General Result**:
* 🟢 **Not Met**: All conditions not met (normal)
* 🔴 **Met**: At least one condition met (anomaly detected)
* **Operations**: Menu button (⋮)
**Configuration Fields:**
| Field | Description |
| ----------------------------- | ------------------------------------------------------------------------------------------------------------------------------ |
| **query/filter rate percent** | Enables expressing the ratio of only the filter result to the query result in the filter and query at runtime as a percentage. |
| **above** | Specifies how the found metric will be compared with the next value. |
| **90** | Specifies the value to be compared with the metric. |
| **for ... time** | Specifies that this condition must be met for the last ... times. |
**Example Scenario:**
* Query/Filter Rate: 90%
* Operator: Above
* Repeat Count: 3
* **Meaning**: Anomaly is detected when the ratio of query results to filter results exceeds 90% and this situation is repeated 3 times.
### Step 5: Action Configuration
Configure actions to be triggered when an anomaly is detected:
Click the **"Select Action"** button
Supported action types:
* **Email**: Sends email notification
* **API Call**: Sends HTTP POST request
* **Webhook**: Sends notification to webhook endpoint
* And more...
Fill in the necessary information according to the action type
For detailed information about actions, see the [Connectors](/en/integrations/connectors/overview) page.
### Step 6: Saving
After filling in all information:
1. Make sure form validations pass:
* ✅ Name entered and available
* ✅ Environment selected
* ✅ Query defined
* ✅ At least one condition defined
* ✅ Scheduling settings configured
2. Click the **"Save"** button
3. After the detector is saved, you are automatically redirected to the listing page
## Monitoring and Reporting Results
### Accessing Results Page
1. Click the detector name in the detector list OR
2. Select **"Results"** option from the operations menu (⋮)
### Results Page Sections
Table showing detailed results of each analysis run:
**Columns:**
* **Date/Time**: Date and time when the analysis run was performed
* **Condition Results**: Result of each condition:
* 🟢 **Not Met (NOT MET)**: Condition not met (normal)
* 🔴 **Met (MET)**: Condition met (anomaly detected)
* 🟠 **Error (ERROR)**: Error occurred during analysis
* **General Result**:
* 🟢 **Not Met**: All conditions not met (normal)
* 🔴 **Met**: At least one condition met (anomaly detected)
* **Operations**: Menu button (⋮)
 Charts showing values over time for each condition:
* **Metric Charts**: Change of metric values over time
* **EMA Charts**: EMA values and upper/lower bands
* **Anomaly Markers**: Points where anomalies were detected on the chart
It is also possible to see these values graphically in the Overview tab.
1. Click the **menu button** (⋮) in the table
2. Select one of the following options:
* **View Error Message**: View errors that occurred during analysis
* **View Condition Results**: View detailed results of each condition
* **View Action Results**: View notification sending status
* **Delete**: Delete the result
## Anomaly Detector Management
### List Page Features
You can view and manage all your detectors on the detector list page.
* **Search by Name**: Filter detectors by typing in the name field
* **Search by Description**: Search by typing in the description field
* **Project Filter** (in Admin mode): View detectors from multiple projects
* **Clear**: Click the eraser icon to clear all filters
* **Name**: Name of the detector (clickable, goes to results page)
* **Description**: Detector description
* **Environment**: Analyzed environment
* **Status**: Active/Passive status (can be changed with toggle)
* **Project** (in Admin mode): Project the detector belongs to
* **Operations**: Menu button (⋮)
You can perform the following operations by clicking the menu button (⋮) for each detector:
1. **Results**: View analysis results of the detector
2. **Edit**: Update detector settings
3. **Delete**: Delete the detector
4. **Move to Global** (if it's a project detector): Move the detector to global project
To change the active/passive status of the detector:
1. Click the toggle in the **Status** column in the table
2. Detector status is updated instantly
3. Passive detectors do not run, but historical data is preserved
## Best Practices
* Use descriptive names: `Response Time Anomaly Detection`
* Add project/module prefix: `E-Commerce - Error Rate Monitoring`
* Add environment information: `Production - Traffic Anomaly Detector`
* Use specific queries
* Improve performance by filtering unnecessary data
* Select appropriate date range (too wide ranges reduce performance)
* Metric conditions: For simple threshold checks
* Rate conditions: To detect changes
* EMA conditions: For statistical anomaly detection
* Reduce false positives by increasing repeat count
* High Sensitivity (0.5-1.0): For critical systems
* Medium Sensitivity (1.0-1.5): For normal systems (recommended)
* Low Sensitivity (1.5-2.0): For test systems
## Frequently Asked Questions
The frequency of detector runs depends on the **Scheduling** (Cron Expression) settings you specify when creating it. For example:
* `0 */5 * ? * *` → Every 5 minutes
* `0 0 * ? * *` → Every hour
* `0 0 9 * ? *` → Every day at 09:00
When the detector is set to passive:
* No new analyses are performed
* Existing scheduled jobs are cancelled
* Historical results are preserved and can be viewed
* Detector continues normal operation when set to active again
* **Metric Condition**: Did the value exceed a certain threshold? (Simple threshold check)
* **Rate Condition**: Did the value increase/decrease by a certain rate? (Change check)
* **EMA Condition**: Is the value statistically abnormal? (Statistical analysis)
EMA sensitivity determines how sensitive anomaly detection will be:
* **High Sensitivity (0.5-1.0)**: Detects more anomalies (more sensitive)
* **Medium Sensitivity (1.0-1.5)**: Balanced anomaly detection (recommended)
* **Low Sensitivity (1.5-2.0)**: Detects fewer anomalies (less sensitive)
**Recommendation**: Start with medium sensitivity (1.0-1.5), adjust based on results.
Repeat count is used to reduce false positives:
* **Repeat Count: 1**: Anomaly is detected when condition is met once
* **Repeat Count: 3**: Anomaly is detected when condition is met 3 times consecutively
**Recommendation**: Use low repeat count (1-2) for critical systems, high repeat count (3-5) for normal systems.
Yes, you can use multiple conditions. Anomaly is detected when **at least one condition** is met. For example:
* Condition 1: Response time > 1000 ms
* Condition 2: Error rate > 10%
* Result: Anomaly is detected when either of the two conditions is met
* **Query**: Defines the API traffic to be analyzed (which APIs, which methods, etc.)
* **Filter**: Further narrows down query results (date range, result type, etc.)
## Troubleshooting
**Possible Causes:**
1. Detector may be in passive status → Check status toggle
2. Scheduling settings may be wrong → Check cron expression
3. Environment may not have Elasticsearch integration → Check environment settings
4. Query may be incorrectly configured → Check query settings
**Solution:**
* Set detector status to active
* Check scheduling settings
* Check environment Elasticsearch integration
* Check query configuration
**Possible Causes:**
1. Query incorrectly configured
2. Filter incorrectly configured
3. Elasticsearch connection issue
4. No data
**Solution:**
* Check query configuration
* Check filter configuration
* Check Elasticsearch connection
* Check if data exists
**Possible Causes:**
1. Threshold values too low
2. Repeat count too low
3. EMA sensitivity too high
**Solution:**
* Increase threshold values
* Increase repeat count
* Decrease EMA sensitivity
**Possible Causes:**
1. Threshold values too high
2. EMA sensitivity too low
3. Repeat count too high
**Solution:**
* Decrease threshold values
* Increase EMA sensitivity
* Decrease repeat count
## Additional Resources
Query configuration and usage
Filter configuration and usage
Notification and action configuration
Cron expression and scheduling settings
Charts showing values over time for each condition:
* **Metric Charts**: Change of metric values over time
* **EMA Charts**: EMA values and upper/lower bands
* **Anomaly Markers**: Points where anomalies were detected on the chart
It is also possible to see these values graphically in the Overview tab.
1. Click the **menu button** (⋮) in the table
2. Select one of the following options:
* **View Error Message**: View errors that occurred during analysis
* **View Condition Results**: View detailed results of each condition
* **View Action Results**: View notification sending status
* **Delete**: Delete the result
## Anomaly Detector Management
### List Page Features
You can view and manage all your detectors on the detector list page.
* **Search by Name**: Filter detectors by typing in the name field
* **Search by Description**: Search by typing in the description field
* **Project Filter** (in Admin mode): View detectors from multiple projects
* **Clear**: Click the eraser icon to clear all filters
* **Name**: Name of the detector (clickable, goes to results page)
* **Description**: Detector description
* **Environment**: Analyzed environment
* **Status**: Active/Passive status (can be changed with toggle)
* **Project** (in Admin mode): Project the detector belongs to
* **Operations**: Menu button (⋮)
You can perform the following operations by clicking the menu button (⋮) for each detector:
1. **Results**: View analysis results of the detector
2. **Edit**: Update detector settings
3. **Delete**: Delete the detector
4. **Move to Global** (if it's a project detector): Move the detector to global project
To change the active/passive status of the detector:
1. Click the toggle in the **Status** column in the table
2. Detector status is updated instantly
3. Passive detectors do not run, but historical data is preserved
## Best Practices
* Use descriptive names: `Response Time Anomaly Detection`
* Add project/module prefix: `E-Commerce - Error Rate Monitoring`
* Add environment information: `Production - Traffic Anomaly Detector`
* Use specific queries
* Improve performance by filtering unnecessary data
* Select appropriate date range (too wide ranges reduce performance)
* Metric conditions: For simple threshold checks
* Rate conditions: To detect changes
* EMA conditions: For statistical anomaly detection
* Reduce false positives by increasing repeat count
* High Sensitivity (0.5-1.0): For critical systems
* Medium Sensitivity (1.0-1.5): For normal systems (recommended)
* Low Sensitivity (1.5-2.0): For test systems
## Frequently Asked Questions
The frequency of detector runs depends on the **Scheduling** (Cron Expression) settings you specify when creating it. For example:
* `0 */5 * ? * *` → Every 5 minutes
* `0 0 * ? * *` → Every hour
* `0 0 9 * ? *` → Every day at 09:00
When the detector is set to passive:
* No new analyses are performed
* Existing scheduled jobs are cancelled
* Historical results are preserved and can be viewed
* Detector continues normal operation when set to active again
* **Metric Condition**: Did the value exceed a certain threshold? (Simple threshold check)
* **Rate Condition**: Did the value increase/decrease by a certain rate? (Change check)
* **EMA Condition**: Is the value statistically abnormal? (Statistical analysis)
EMA sensitivity determines how sensitive anomaly detection will be:
* **High Sensitivity (0.5-1.0)**: Detects more anomalies (more sensitive)
* **Medium Sensitivity (1.0-1.5)**: Balanced anomaly detection (recommended)
* **Low Sensitivity (1.5-2.0)**: Detects fewer anomalies (less sensitive)
**Recommendation**: Start with medium sensitivity (1.0-1.5), adjust based on results.
Repeat count is used to reduce false positives:
* **Repeat Count: 1**: Anomaly is detected when condition is met once
* **Repeat Count: 3**: Anomaly is detected when condition is met 3 times consecutively
**Recommendation**: Use low repeat count (1-2) for critical systems, high repeat count (3-5) for normal systems.
Yes, you can use multiple conditions. Anomaly is detected when **at least one condition** is met. For example:
* Condition 1: Response time > 1000 ms
* Condition 2: Error rate > 10%
* Result: Anomaly is detected when either of the two conditions is met
* **Query**: Defines the API traffic to be analyzed (which APIs, which methods, etc.)
* **Filter**: Further narrows down query results (date range, result type, etc.)
## Troubleshooting
**Possible Causes:**
1. Detector may be in passive status → Check status toggle
2. Scheduling settings may be wrong → Check cron expression
3. Environment may not have Elasticsearch integration → Check environment settings
4. Query may be incorrectly configured → Check query settings
**Solution:**
* Set detector status to active
* Check scheduling settings
* Check environment Elasticsearch integration
* Check query configuration
**Possible Causes:**
1. Query incorrectly configured
2. Filter incorrectly configured
3. Elasticsearch connection issue
4. No data
**Solution:**
* Check query configuration
* Check filter configuration
* Check Elasticsearch connection
* Check if data exists
**Possible Causes:**
1. Threshold values too low
2. Repeat count too low
3. EMA sensitivity too high
**Solution:**
* Increase threshold values
* Increase repeat count
* Decrease EMA sensitivity
**Possible Causes:**
1. Threshold values too high
2. EMA sensitivity too low
3. Repeat count too high
**Solution:**
* Decrease threshold values
* Increase EMA sensitivity
* Decrease repeat count
## Additional Resources
Query configuration and usage
Filter configuration and usage
Notification and action configuration
Cron expression and scheduling settings