> ## Documentation Index
> Fetch the complete documentation index at: https://docs.apinizer.com/llms.txt
> Use this file to discover all available pages before exploring further.
# API Health Check
> You can automatically check whether APIs and web services are continuously running, track performance metrics, detect problems early, and send notifications in case of failures.
## Overview
Continuously monitor the availability of your APIs
Track response times and success rates
Detect problems before users are affected
Receive instant notifications for quick intervention
 ## What is API Health Check?
### Basic Concept
API Health Check is a monitoring system that **automatically sends test requests at specified intervals** to an API endpoint or web service you specify.
Continuous monitoring of critical APIs such as payment and authentication
Tracking and reporting of service level agreements
Monitoring API response times and trend analysis
Tracking service uptime
URL to be checked, HTTP method, expectations, and scheduling are determined
Test requests are automatically sent at specified times (e.g., every 5 minutes)
HTTP request is sent and response is received
Expectations (assertions) are checked:
* Response time check
* HTTP status code check
* Response content check
* XPath/JSONPath checks
Test result is recorded (successful/failed)
If the test fails, configured notifications are triggered
## Quick Start
### Creating Your First Health Check
Click **Main Menu** → **Monitoring** → **API Health Check**
Click the **"Create New"** button
* **Name**: A name for your check (e.g., "Payment API Check")
* **Description**: Optional description
* **HTTP Method**: GET, POST, etc.
* **URL**: API endpoint to be tested
Determine check frequency (e.g., Every 5 minutes)
Click the **"Save"** button
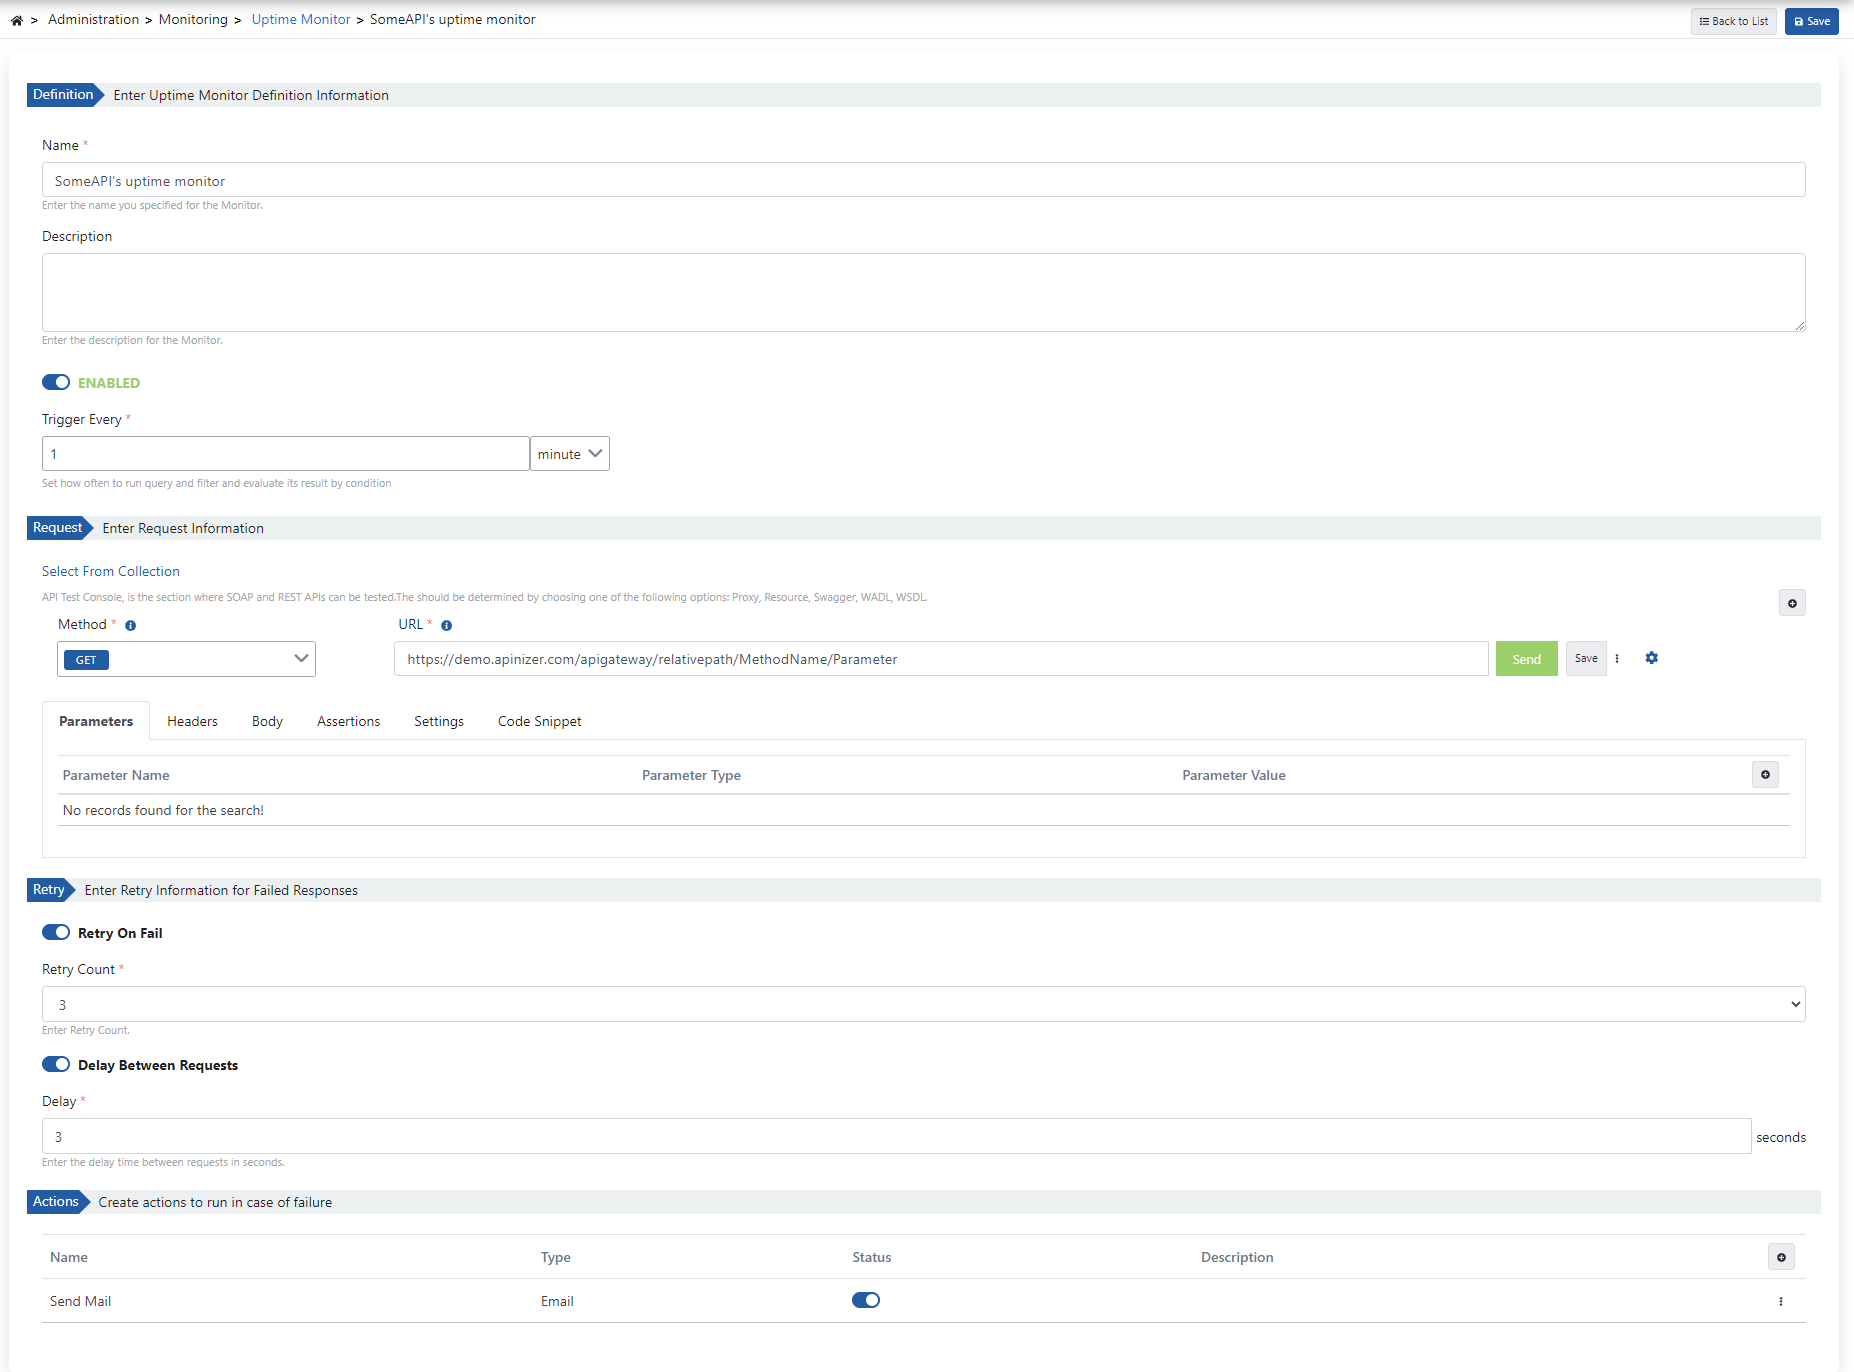
## Creating New Health Check
### Step 1: Basic Information
Enter a unique name for the health check. This name:
* Must be unique within the project
* Cannot start with a space
* System automatically checks the availability of the name
**Good Name Examples:**
* `Payment API Monitoring`
* `User Service Health Check`
* `Third-Party Integration Check`
* `Homepage Availability Check`
You can enter descriptive information about the health check:
* Maximum 1000 characters
* Used to explain the purpose and scope of the check
* Displayed on the list page
**Example Descriptions:**
* `Created for 24/7 monitoring of critical payment API`
* `Customer portal homepage availability check`
* `Third-party service provider integration monitoring`
Determines the active/passive status of the health check:
* **Active**: Check runs, scheduled tests are sent
* **Passive**: Check is stopped, no tests are sent (historical data is preserved)
### Step 2: Scheduling Settings
Determine how frequently the health check will run. Scheduling is done using **Cron Expression**.
#### Common Scheduling Examples
| Description | Cron Expression | Use Case |
| --------------------- | ---------------- | --------------------------------- |
| Every 5 minutes | `0 */5 * ? * *` | For critical APIs (most common) |
| Every 15 minutes | `0 */15 * ? * *` | For normal APIs |
| Every hour | `0 0 * ? * *` | For Test/Development environments |
| Every day at 09:00 | `0 0 9 * ? *` | For daily reporting |
| Every Monday at 09:00 | `0 0 9 ? * MON` | For weekly checks |
**Recommendations:**
* **Critical APIs**: Every 5 minutes
* **Normal APIs**: Every 15-30 minutes
* **Test/Development**: Every hour
* **Reporting purposes**: Daily or weekly
### Step 3: Request Settings
In this section, you configure the information of the endpoint to be tested.
You can use test scenarios you previously created in Test Console:
Click the **"Select From Collection"** button
View your test collections in the opened dialog
Select the test scenario you want
Test information automatically fills the form
**Advantages:**
* You save time
* You use consistent test scenarios
* You can manage your test scenarios centrally
Select HTTP request method:
Data reading (most commonly used)
Data sending
Data updating
Data deletion
Partial update
Header information only
Enter the full URL of the endpoint to be tested:
**Examples:**
* `https://api.example.com/users`
* `https://api.example.com/payment/verify`
* `http://localhost:8080/health`
* `https://api.example.com/v1/products?category=electronics`
**Notes:**
* URL must be absolute
* HTTPS and HTTP are supported
* Query parameters can be added to URL or specified in a separate field
Used to add query parameters to URL:
**Example:**
* Parameter Name: `userId`
* Parameter Value: `12345`
**Result URL:** `https://api.example.com/users?userId=12345`
Used to add headers to HTTP request:
**Common Uses:**
* **Authorization**: `Bearer token123` or `Basic base64encoded`
* **Content-Type**: `application/json`, `application/xml`
* **X-API-Key**: `your-api-key`
* **Custom Headers**: Custom headers
**Example:**
* Header Name: `Authorization`
* Header Value: `Bearer eyJhbGciOiJIUzI1NiIsInR5cCI6IkpXVCJ9...`
You can enter request body:
**Supported Formats:**
* **Raw**: JSON, XML, Text
* **Form URL Encoded**: Form data
**JSON Example:**
```json theme={null}
{
"userId": 12345,
"action": "verify",
"timestamp": "2024-01-15T10:30:00Z"
}
```
**XML Example:**
```xml theme={null}
12345
verify
```
### Step 4: Validation Settings
Validation (Assertion) settings determine the checks required for the test result to be considered successful.
When this option is activated, the specified timeout value is also used for validation:
* Request must be responded to within the specified time
* Otherwise test is considered failed
To perform HTTP status code check:
Activate the **"Result Status Code"** toggle
Enter the expected status code in the **"Expected Status Code"** field
**Default Value:** `200` (OK)
**Common Status Codes:**
* `200`: Successful
* `201`: Created
* `204`: No Content
* `400`: Bad Request
* `401`: Unauthorized
* `404`: Not Found
* `500`: Server Error
**Example Scenario:**
* Expected Status Code: `200`
* Actual Status Code: `200` → ✅ Successful
* Actual Status Code: `500` → ❌ Failed
Checks whether the response body contains specific content:
Activate the **"Result Body"** toggle
Enter the expected content in the **"Expected Result Body"** field
**Use Cases:**
* Response should contain specific text: `"status": "success"`
* Response should contain specific value: `"active": true`
* Response should not be empty
**Example:**
* Expected: `"status": "ok"`
* Actual: `{"status": "ok", "data": {...}}` → ✅ Successful
* Actual: `{"status": "error"}` → ❌ Failed
Performs check using XPath in XML responses:
Activate the **"XPath Result"** toggle
Enter the XPath expression in the **XPath** field
Enter the expected value in the **Expected XPath Result** field
**Example:**
* XPath: `/response/status`
* Expected Result: `success`
* Actual XML: `success` → ✅ Successful
Performs check using JSONPath in JSON responses:
Activate the **"JsonPath Result"** toggle
Enter the JSONPath expression in the **JsonPath** field
Enter the expected value in the **Expected JsonPath Result** field
**Example:**
* JSONPath: `$.status`
* Expected Result: `ok`
* Actual JSON: `{"status": "ok", "data": {...}}` → ✅ Successful
**Common JSONPath Examples:**
* `$.status`: Status field at root
* `$.data.items[0].id`: ID of first item
* `$.user.name`: Name field of user object
* `$.results[*].id`: IDs of all results
### Step 5: Settings
Determines the maximum wait time for the request:
* Entered in **seconds**
* Default value: `30` seconds
* If no response is received within this time, test is considered failed
**Recommendations:**
* For fast APIs: `10-15` seconds
* For normal APIs: `30` seconds
* For slow APIs: `60` seconds or more
To use SSL certificate for HTTPS requests:
* When this option is activated, custom SSL certificate can be used
* Generally used for self-signed certificates or custom CA certificates
### Step 6: Retry Settings
To automatically retry in case of temporary issues:
Activate the **"Retry On Fail"** toggle
Select **"Retry Count"**: `1`, `3`, `5`, or `10`
**How It Works:**
* If the first request fails
* Retries are made up to the specified number
* Wait can be made between each attempt (optional)
**Example Scenario:**
* Retry Count: `3`
* First request failed → 1st retry → failed → 2nd retry → failed → 3rd retry → successful → ✅ Successful
To wait between retries:
Activate the **"Delay Between Requests"** toggle
Enter the wait time in seconds in the **"Wait"** field
**Default Value:** `3` seconds
**Use Case:**
* To reduce server load
* To avoid rate limiting
* To give time for temporary issues to resolve
**Example:**
* Retry Count: `3`
* Wait: `5` seconds
* First request failed → wait 5 sec → 1st retry → failed → wait 5 sec → 2nd retry → successful
### Step 7: Notification Recipients
Configure notifications that will be triggered when the test fails:
#### Adding Notifications
Click the **"+"** button in the **Recipients** table
Select notification type:
* **Email**: Sends email notification
* **Webhook**: Sends HTTP POST request
* **Slack**: Sends message to Slack channel
* **SMS**: Sends SMS notification
* And more...
Complete the notification configuration
**Notification Management:**
* **Edit**: Select "Edit" from the menu to update notification information
* **Delete**: Select "Delete" from the menu to remove the notification
* **Active/Passive**: You can activate/deactivate the notification with toggle
**Notification Content:**
The following information is sent in notifications:
* Health check name
* Proxy name (if any)
* Target URL
* Error message
* Timestamp
* Test result details
### Step 8: Saving
After filling in all information:
Make sure form validations pass:
* ✅ Name entered and available
* ✅ URL entered
* ✅ Scheduling settings configured
* ✅ At least one assertion active (recommended)
Click the **"Save"** button
After the health check is saved, you will be automatically redirected to the listing page
## Monitoring and Reporting Results
### Accessing Results Page
Click on the check name in the health check list
Select **"Results"** option from the operations menu (⋮)
### Results Page Sections
* **Date Range Selector**: Filter results by a specific date range
* **Refresh Button**: Manually refresh results
* **HTTP Method and URL**: Information about the tested endpoint
The general status of the health check is shown at the top of the page:
**Response Time Graph:**
* Line graph showing response times over time
* X axis: Date/Time
* Y axis: Response time (milliseconds)
* You can see detailed information by hovering over the graph
**Average Response Time:**
* Average response time of all tests (milliseconds)
* Shown in large and bold text
* Important metric for performance evaluation
**Success Rate:**
* Ratio of successful tests to total tests (percentage)
* Green: Good performance (95%+)
* Yellow: Medium performance (80-95%)
* Red: Low success rate (below 80%)
## What is API Health Check?
### Basic Concept
API Health Check is a monitoring system that **automatically sends test requests at specified intervals** to an API endpoint or web service you specify.
Continuous monitoring of critical APIs such as payment and authentication
Tracking and reporting of service level agreements
Monitoring API response times and trend analysis
Tracking service uptime
URL to be checked, HTTP method, expectations, and scheduling are determined
Test requests are automatically sent at specified times (e.g., every 5 minutes)
HTTP request is sent and response is received
Expectations (assertions) are checked:
* Response time check
* HTTP status code check
* Response content check
* XPath/JSONPath checks
Test result is recorded (successful/failed)
If the test fails, configured notifications are triggered
## Quick Start
### Creating Your First Health Check
Click **Main Menu** → **Monitoring** → **API Health Check**
Click the **"Create New"** button
* **Name**: A name for your check (e.g., "Payment API Check")
* **Description**: Optional description
* **HTTP Method**: GET, POST, etc.
* **URL**: API endpoint to be tested
Determine check frequency (e.g., Every 5 minutes)
Click the **"Save"** button
## Creating New Health Check
### Step 1: Basic Information
Enter a unique name for the health check. This name:
* Must be unique within the project
* Cannot start with a space
* System automatically checks the availability of the name
**Good Name Examples:**
* `Payment API Monitoring`
* `User Service Health Check`
* `Third-Party Integration Check`
* `Homepage Availability Check`
You can enter descriptive information about the health check:
* Maximum 1000 characters
* Used to explain the purpose and scope of the check
* Displayed on the list page
**Example Descriptions:**
* `Created for 24/7 monitoring of critical payment API`
* `Customer portal homepage availability check`
* `Third-party service provider integration monitoring`
Determines the active/passive status of the health check:
* **Active**: Check runs, scheduled tests are sent
* **Passive**: Check is stopped, no tests are sent (historical data is preserved)
### Step 2: Scheduling Settings
Determine how frequently the health check will run. Scheduling is done using **Cron Expression**.
#### Common Scheduling Examples
| Description | Cron Expression | Use Case |
| --------------------- | ---------------- | --------------------------------- |
| Every 5 minutes | `0 */5 * ? * *` | For critical APIs (most common) |
| Every 15 minutes | `0 */15 * ? * *` | For normal APIs |
| Every hour | `0 0 * ? * *` | For Test/Development environments |
| Every day at 09:00 | `0 0 9 * ? *` | For daily reporting |
| Every Monday at 09:00 | `0 0 9 ? * MON` | For weekly checks |
**Recommendations:**
* **Critical APIs**: Every 5 minutes
* **Normal APIs**: Every 15-30 minutes
* **Test/Development**: Every hour
* **Reporting purposes**: Daily or weekly
### Step 3: Request Settings
In this section, you configure the information of the endpoint to be tested.
You can use test scenarios you previously created in Test Console:
Click the **"Select From Collection"** button
View your test collections in the opened dialog
Select the test scenario you want
Test information automatically fills the form
**Advantages:**
* You save time
* You use consistent test scenarios
* You can manage your test scenarios centrally
Select HTTP request method:
Data reading (most commonly used)
Data sending
Data updating
Data deletion
Partial update
Header information only
Enter the full URL of the endpoint to be tested:
**Examples:**
* `https://api.example.com/users`
* `https://api.example.com/payment/verify`
* `http://localhost:8080/health`
* `https://api.example.com/v1/products?category=electronics`
**Notes:**
* URL must be absolute
* HTTPS and HTTP are supported
* Query parameters can be added to URL or specified in a separate field
Used to add query parameters to URL:
**Example:**
* Parameter Name: `userId`
* Parameter Value: `12345`
**Result URL:** `https://api.example.com/users?userId=12345`
Used to add headers to HTTP request:
**Common Uses:**
* **Authorization**: `Bearer token123` or `Basic base64encoded`
* **Content-Type**: `application/json`, `application/xml`
* **X-API-Key**: `your-api-key`
* **Custom Headers**: Custom headers
**Example:**
* Header Name: `Authorization`
* Header Value: `Bearer eyJhbGciOiJIUzI1NiIsInR5cCI6IkpXVCJ9...`
You can enter request body:
**Supported Formats:**
* **Raw**: JSON, XML, Text
* **Form URL Encoded**: Form data
**JSON Example:**
```json theme={null}
{
"userId": 12345,
"action": "verify",
"timestamp": "2024-01-15T10:30:00Z"
}
```
**XML Example:**
```xml theme={null}
12345
verify
```
### Step 4: Validation Settings
Validation (Assertion) settings determine the checks required for the test result to be considered successful.
When this option is activated, the specified timeout value is also used for validation:
* Request must be responded to within the specified time
* Otherwise test is considered failed
To perform HTTP status code check:
Activate the **"Result Status Code"** toggle
Enter the expected status code in the **"Expected Status Code"** field
**Default Value:** `200` (OK)
**Common Status Codes:**
* `200`: Successful
* `201`: Created
* `204`: No Content
* `400`: Bad Request
* `401`: Unauthorized
* `404`: Not Found
* `500`: Server Error
**Example Scenario:**
* Expected Status Code: `200`
* Actual Status Code: `200` → ✅ Successful
* Actual Status Code: `500` → ❌ Failed
Checks whether the response body contains specific content:
Activate the **"Result Body"** toggle
Enter the expected content in the **"Expected Result Body"** field
**Use Cases:**
* Response should contain specific text: `"status": "success"`
* Response should contain specific value: `"active": true`
* Response should not be empty
**Example:**
* Expected: `"status": "ok"`
* Actual: `{"status": "ok", "data": {...}}` → ✅ Successful
* Actual: `{"status": "error"}` → ❌ Failed
Performs check using XPath in XML responses:
Activate the **"XPath Result"** toggle
Enter the XPath expression in the **XPath** field
Enter the expected value in the **Expected XPath Result** field
**Example:**
* XPath: `/response/status`
* Expected Result: `success`
* Actual XML: `success` → ✅ Successful
Performs check using JSONPath in JSON responses:
Activate the **"JsonPath Result"** toggle
Enter the JSONPath expression in the **JsonPath** field
Enter the expected value in the **Expected JsonPath Result** field
**Example:**
* JSONPath: `$.status`
* Expected Result: `ok`
* Actual JSON: `{"status": "ok", "data": {...}}` → ✅ Successful
**Common JSONPath Examples:**
* `$.status`: Status field at root
* `$.data.items[0].id`: ID of first item
* `$.user.name`: Name field of user object
* `$.results[*].id`: IDs of all results
### Step 5: Settings
Determines the maximum wait time for the request:
* Entered in **seconds**
* Default value: `30` seconds
* If no response is received within this time, test is considered failed
**Recommendations:**
* For fast APIs: `10-15` seconds
* For normal APIs: `30` seconds
* For slow APIs: `60` seconds or more
To use SSL certificate for HTTPS requests:
* When this option is activated, custom SSL certificate can be used
* Generally used for self-signed certificates or custom CA certificates
### Step 6: Retry Settings
To automatically retry in case of temporary issues:
Activate the **"Retry On Fail"** toggle
Select **"Retry Count"**: `1`, `3`, `5`, or `10`
**How It Works:**
* If the first request fails
* Retries are made up to the specified number
* Wait can be made between each attempt (optional)
**Example Scenario:**
* Retry Count: `3`
* First request failed → 1st retry → failed → 2nd retry → failed → 3rd retry → successful → ✅ Successful
To wait between retries:
Activate the **"Delay Between Requests"** toggle
Enter the wait time in seconds in the **"Wait"** field
**Default Value:** `3` seconds
**Use Case:**
* To reduce server load
* To avoid rate limiting
* To give time for temporary issues to resolve
**Example:**
* Retry Count: `3`
* Wait: `5` seconds
* First request failed → wait 5 sec → 1st retry → failed → wait 5 sec → 2nd retry → successful
### Step 7: Notification Recipients
Configure notifications that will be triggered when the test fails:
#### Adding Notifications
Click the **"+"** button in the **Recipients** table
Select notification type:
* **Email**: Sends email notification
* **Webhook**: Sends HTTP POST request
* **Slack**: Sends message to Slack channel
* **SMS**: Sends SMS notification
* And more...
Complete the notification configuration
**Notification Management:**
* **Edit**: Select "Edit" from the menu to update notification information
* **Delete**: Select "Delete" from the menu to remove the notification
* **Active/Passive**: You can activate/deactivate the notification with toggle
**Notification Content:**
The following information is sent in notifications:
* Health check name
* Proxy name (if any)
* Target URL
* Error message
* Timestamp
* Test result details
### Step 8: Saving
After filling in all information:
Make sure form validations pass:
* ✅ Name entered and available
* ✅ URL entered
* ✅ Scheduling settings configured
* ✅ At least one assertion active (recommended)
Click the **"Save"** button
After the health check is saved, you will be automatically redirected to the listing page
## Monitoring and Reporting Results
### Accessing Results Page
Click on the check name in the health check list
Select **"Results"** option from the operations menu (⋮)
### Results Page Sections
* **Date Range Selector**: Filter results by a specific date range
* **Refresh Button**: Manually refresh results
* **HTTP Method and URL**: Information about the tested endpoint
The general status of the health check is shown at the top of the page:
**Response Time Graph:**
* Line graph showing response times over time
* X axis: Date/Time
* Y axis: Response time (milliseconds)
* You can see detailed information by hovering over the graph
**Average Response Time:**
* Average response time of all tests (milliseconds)
* Shown in large and bold text
* Important metric for performance evaluation
**Success Rate:**
* Ratio of successful tests to total tests (percentage)
* Green: Good performance (95%+)
* Yellow: Medium performance (80-95%)
* Red: Low success rate (below 80%)
 Table showing detailed results of each test run:
**Columns:**
* **Request Sent**: Date and time when the test request was sent
* **Request Type**:
* **Initial Request**: Normal test request
* **Retry**: Retry request
* **Response Time**: Response time of the request (milliseconds)
* **Assertions**: Checks performed and their results:
* ✅ **Timeout**: Request did not timeout
* ✅ **Status Code**: Expected HTTP status code returned
* ✅ **Result Body**: Response body validated
* ✅ **XPath**: XPath check successful (for XML)
* ✅ **JSONPath**: JSONPath check successful (for JSON)
* **Result**:
* 🟢 **Successful**: All checks passed
* 🔴 **Failed**: At least one check failed
* **Detail**: Eye icon (👁️) to view result details in JSON format
#### Viewing Result Details
Click the **eye icon** (👁️) button in the table
In the opened dialog, you can view all details of the test result in JSON format:
* Request information (URL, method, headers, body)
* Response information (status code, headers, body)
* Assertion results (result of each check)
* Error messages (if any)
* Timestamps
#### Deleting All Results
This operation cannot be undone! All historical data will be lost.
Click the **trash can** (🗑️) icon in the table header
All results are permanently deleted
## Health Check Management
### List Page Features
On the health check list page, you can view and manage all your checks.
* **Search by Name**: Filter checks by typing in the name field
* **Search by Description**: Search by typing in the description field
* **Project Filter** (Admin mode): View checks from multiple projects
* **Clear**: Click the eraser icon to clear all filters
* **Name**: Health check name (clickable, goes to results page)
* **Description**: Check description
* **Target URL**: URL of the tested endpoint
* **Status**: Active/Passive status (can be changed with toggle)
* **Project** (Admin mode): Project the check belongs to
* **Operations**: Menu button (⋮)
For each check, click the menu button (⋮) to perform the following operations:
1. **Results**: View check execution results
2. **Edit**: Update check settings
3. **Delete**: Delete the check
4. **Move to Global** (if project check): Move check to global project
To change the active/passive status of the check:
Click the toggle in the **Status** column in the table
Check status is updated instantly
Passive checks do not run, but their historical data is preserved
## Best Practices
* **Use Descriptive Names**: Clear names like `Payment API Check`
* **Add Project/Module Prefix**: Like `E-Commerce - Payment API`
* **Add Environment Information**: Like `Production - User API`
* **Critical APIs**: Check every 5 minutes
* **Normal APIs**: Check every 15-30 minutes
* **Test Environments**: Check every hour
* **Consider server load**
* **Use at least one assertion** (Status Code recommended)
* **Always activate timeout assertion**
* **Use body assertions carefully** (if variable content exists)
* **Make specific checks using JSONPath/XPath**
* **Use retry for temporary issues**
* **Keep retry count reasonable** (between 3-5)
* **Reduce server load by using delay**
* **Increase delay in rate limiting situations**
* **Use email + SMS notification for critical checks**
* **Send notifications to your integration systems using Webhook**
* **Filter to avoid notification spam**
* **Create notification groups**
* **Regularly check response times**
* **Track success rates** (aim for 95%+)
* **Perform trend analysis** (examine graphs)
* **Set threshold values for anomaly detection**
## Frequently Asked Questions
The frequency of check execution depends on the **Scheduling** (Cron Expression) settings you determined when creating it. For example:
* `0 */5 * ? * *` → Every 5 minutes
* `0 0 * ? * *` → Every hour
* `0 0 9 * ? *` → Every day at 09:00
When check is deactivated:
* No new test requests are sent
* Existing scheduled jobs are cancelled
* Historical results are preserved and can be viewed
* Check continues normal operation when reactivated
When "Retry On Fail" feature is activated:
1. First request is sent
2. If it fails (any assertion fails)
3. Retries are made up to the number you specified
4. If there is wait between requests, wait for the specified duration
5. If all attempts fail, result is recorded as "Failed"
Notifications (Recipients) are triggered in the following situations:
* When test fails
* Separate notification is sent for each failed test
* Notifications are not sent for successful tests (default behavior)
Assertion checks are performed in the following order:
1. **Timeout Check**: Was the request responded to within the specified time?
2. **Status Code Check**: Does HTTP status code match the expected value?
3. **Body Check**: Does response body match the expected content?
4. **XPath Check**: Does XPath expression give correct result in XML response?
5. **JSONPath Check**: Does JSONPath expression give correct result in JSON response?
**Important:** All active assertions must be successful. If any one fails, the test result is marked as "Failed".
The select from test collection feature allows you to reuse test scenarios you previously created in Test Console. This way:
* You save time
* You use consistent test scenarios
* You can manage your test scenarios centrally
When check is deleted:
* Check definition is deleted from database
* All test results are deleted
* Scheduled jobs are cancelled
* Historical data is permanently lost
Deletion cannot be undone!
Results are kept until manually deleted. To clean old results:
* You can use the "Delete All Results" button on the results page
* Or you can clean results regularly
Yes, you can use multiple assertions. All active assertions must be successful. For example:
* Status Code: 200 ✅
* "success" text in Body ✅
* JSONPath: `$.status` = "ok" ✅
If all are successful, test is considered successful.
No, dynamic parameters cannot be used in URL. However:
* You can add query parameters
* You can use dynamic values in headers (in some cases)
* You can use dynamic content in body
## Troubleshooting
**Possible Causes:**
1. Check may be in passive status → Check status toggle
2. Scheduling settings may be wrong → Check cron expression
3. URL may not be accessible → Test URL manually
**Solution:**
* Activate check status
* Check scheduling settings
* Make sure URL is accessible
**Possible Causes:**
1. URL is wrong or not accessible
2. Assertion settings are too strict
3. Timeout duration is too short
4. Authentication issues
**Solution:**
* Check URL
* Review assertion settings
* Increase timeout duration
* Check authentication information in headers
**Possible Causes:**
1. Notification is in passive status
2. Notification configuration is incorrect
3. Email/SMS service is not working
**Solution:**
* Activate notification status
* Check notification configuration
* Check Email/SMS service settings
**Possible Causes:**
1. API performance issues
2. Network delays
3. Server load
**Solution:**
* Optimize API performance
* Check network connection
* Check server resources
**Possible Causes:**
1. Check has not run yet
2. Date range filter is wrong
3. Results may have been deleted
**Solution:**
* Make sure check has run
* Check date range filter
* Make sure results have not been deleted
## Additional Resources
Creating test scenarios
Notification and action configuration
Scheduling settings and cron expression
REST API usage
Table showing detailed results of each test run:
**Columns:**
* **Request Sent**: Date and time when the test request was sent
* **Request Type**:
* **Initial Request**: Normal test request
* **Retry**: Retry request
* **Response Time**: Response time of the request (milliseconds)
* **Assertions**: Checks performed and their results:
* ✅ **Timeout**: Request did not timeout
* ✅ **Status Code**: Expected HTTP status code returned
* ✅ **Result Body**: Response body validated
* ✅ **XPath**: XPath check successful (for XML)
* ✅ **JSONPath**: JSONPath check successful (for JSON)
* **Result**:
* 🟢 **Successful**: All checks passed
* 🔴 **Failed**: At least one check failed
* **Detail**: Eye icon (👁️) to view result details in JSON format
#### Viewing Result Details
Click the **eye icon** (👁️) button in the table
In the opened dialog, you can view all details of the test result in JSON format:
* Request information (URL, method, headers, body)
* Response information (status code, headers, body)
* Assertion results (result of each check)
* Error messages (if any)
* Timestamps
#### Deleting All Results
This operation cannot be undone! All historical data will be lost.
Click the **trash can** (🗑️) icon in the table header
All results are permanently deleted
## Health Check Management
### List Page Features
On the health check list page, you can view and manage all your checks.
* **Search by Name**: Filter checks by typing in the name field
* **Search by Description**: Search by typing in the description field
* **Project Filter** (Admin mode): View checks from multiple projects
* **Clear**: Click the eraser icon to clear all filters
* **Name**: Health check name (clickable, goes to results page)
* **Description**: Check description
* **Target URL**: URL of the tested endpoint
* **Status**: Active/Passive status (can be changed with toggle)
* **Project** (Admin mode): Project the check belongs to
* **Operations**: Menu button (⋮)
For each check, click the menu button (⋮) to perform the following operations:
1. **Results**: View check execution results
2. **Edit**: Update check settings
3. **Delete**: Delete the check
4. **Move to Global** (if project check): Move check to global project
To change the active/passive status of the check:
Click the toggle in the **Status** column in the table
Check status is updated instantly
Passive checks do not run, but their historical data is preserved
## Best Practices
* **Use Descriptive Names**: Clear names like `Payment API Check`
* **Add Project/Module Prefix**: Like `E-Commerce - Payment API`
* **Add Environment Information**: Like `Production - User API`
* **Critical APIs**: Check every 5 minutes
* **Normal APIs**: Check every 15-30 minutes
* **Test Environments**: Check every hour
* **Consider server load**
* **Use at least one assertion** (Status Code recommended)
* **Always activate timeout assertion**
* **Use body assertions carefully** (if variable content exists)
* **Make specific checks using JSONPath/XPath**
* **Use retry for temporary issues**
* **Keep retry count reasonable** (between 3-5)
* **Reduce server load by using delay**
* **Increase delay in rate limiting situations**
* **Use email + SMS notification for critical checks**
* **Send notifications to your integration systems using Webhook**
* **Filter to avoid notification spam**
* **Create notification groups**
* **Regularly check response times**
* **Track success rates** (aim for 95%+)
* **Perform trend analysis** (examine graphs)
* **Set threshold values for anomaly detection**
## Frequently Asked Questions
The frequency of check execution depends on the **Scheduling** (Cron Expression) settings you determined when creating it. For example:
* `0 */5 * ? * *` → Every 5 minutes
* `0 0 * ? * *` → Every hour
* `0 0 9 * ? *` → Every day at 09:00
When check is deactivated:
* No new test requests are sent
* Existing scheduled jobs are cancelled
* Historical results are preserved and can be viewed
* Check continues normal operation when reactivated
When "Retry On Fail" feature is activated:
1. First request is sent
2. If it fails (any assertion fails)
3. Retries are made up to the number you specified
4. If there is wait between requests, wait for the specified duration
5. If all attempts fail, result is recorded as "Failed"
Notifications (Recipients) are triggered in the following situations:
* When test fails
* Separate notification is sent for each failed test
* Notifications are not sent for successful tests (default behavior)
Assertion checks are performed in the following order:
1. **Timeout Check**: Was the request responded to within the specified time?
2. **Status Code Check**: Does HTTP status code match the expected value?
3. **Body Check**: Does response body match the expected content?
4. **XPath Check**: Does XPath expression give correct result in XML response?
5. **JSONPath Check**: Does JSONPath expression give correct result in JSON response?
**Important:** All active assertions must be successful. If any one fails, the test result is marked as "Failed".
The select from test collection feature allows you to reuse test scenarios you previously created in Test Console. This way:
* You save time
* You use consistent test scenarios
* You can manage your test scenarios centrally
When check is deleted:
* Check definition is deleted from database
* All test results are deleted
* Scheduled jobs are cancelled
* Historical data is permanently lost
Deletion cannot be undone!
Results are kept until manually deleted. To clean old results:
* You can use the "Delete All Results" button on the results page
* Or you can clean results regularly
Yes, you can use multiple assertions. All active assertions must be successful. For example:
* Status Code: 200 ✅
* "success" text in Body ✅
* JSONPath: `$.status` = "ok" ✅
If all are successful, test is considered successful.
No, dynamic parameters cannot be used in URL. However:
* You can add query parameters
* You can use dynamic values in headers (in some cases)
* You can use dynamic content in body
## Troubleshooting
**Possible Causes:**
1. Check may be in passive status → Check status toggle
2. Scheduling settings may be wrong → Check cron expression
3. URL may not be accessible → Test URL manually
**Solution:**
* Activate check status
* Check scheduling settings
* Make sure URL is accessible
**Possible Causes:**
1. URL is wrong or not accessible
2. Assertion settings are too strict
3. Timeout duration is too short
4. Authentication issues
**Solution:**
* Check URL
* Review assertion settings
* Increase timeout duration
* Check authentication information in headers
**Possible Causes:**
1. Notification is in passive status
2. Notification configuration is incorrect
3. Email/SMS service is not working
**Solution:**
* Activate notification status
* Check notification configuration
* Check Email/SMS service settings
**Possible Causes:**
1. API performance issues
2. Network delays
3. Server load
**Solution:**
* Optimize API performance
* Check network connection
* Check server resources
**Possible Causes:**
1. Check has not run yet
2. Date range filter is wrong
3. Results may have been deleted
**Solution:**
* Make sure check has run
* Check date range filter
* Make sure results have not been deleted
## Additional Resources
Creating test scenarios
Notification and action configuration
Scheduling settings and cron expression
REST API usage