> ## Documentation Index
> Fetch the complete documentation index at: https://docs.apinizer.com/llms.txt
> Use this file to discover all available pages before exploring further.
# Example Dashboards on Grafana for Apinizer Cache
> Provides example dashboard panel configurations that can be used on Grafana to visualize Apinizer Cache metrics. Includes ready-made panel examples that visualize metrics such as cache lookups, memory usage, and API request counts. References related documentation for Grafana Setup and Prometheus Integration as a Data Source.
# Example Dashboards on Grafana for Apinizer Cache
For Grafana Setup and Prometheus Integration as a Data Source, you can refer to the [related documentation](/en/operations/administrator-guides/grafana-prometheus-data-source).
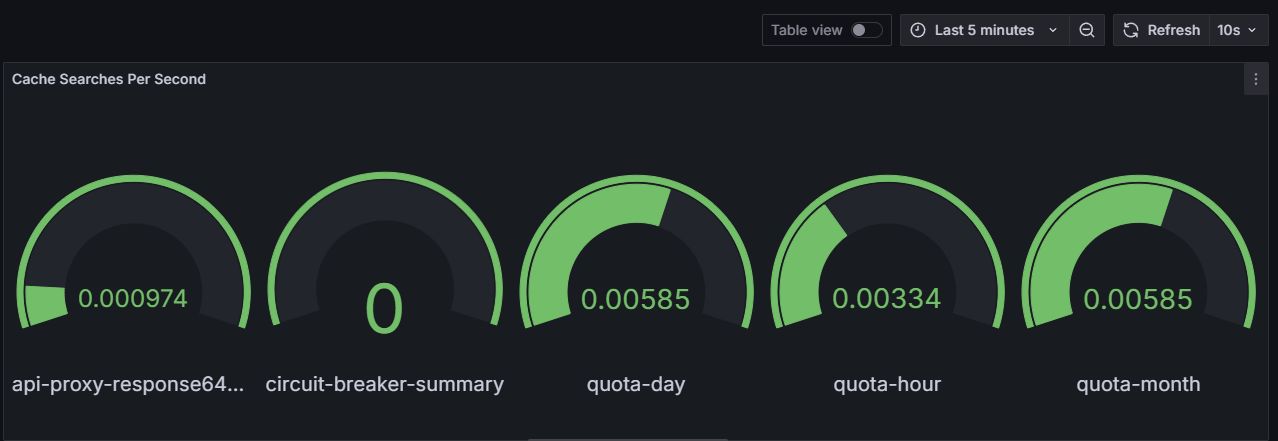
## Panel 1: Cache Lookups Per Second
```promql theme={null}
topk(5, sum by (cache) (rate(cache_gets_total{cache=~".*"}[2h])))
```
**Visualization:** Gauge
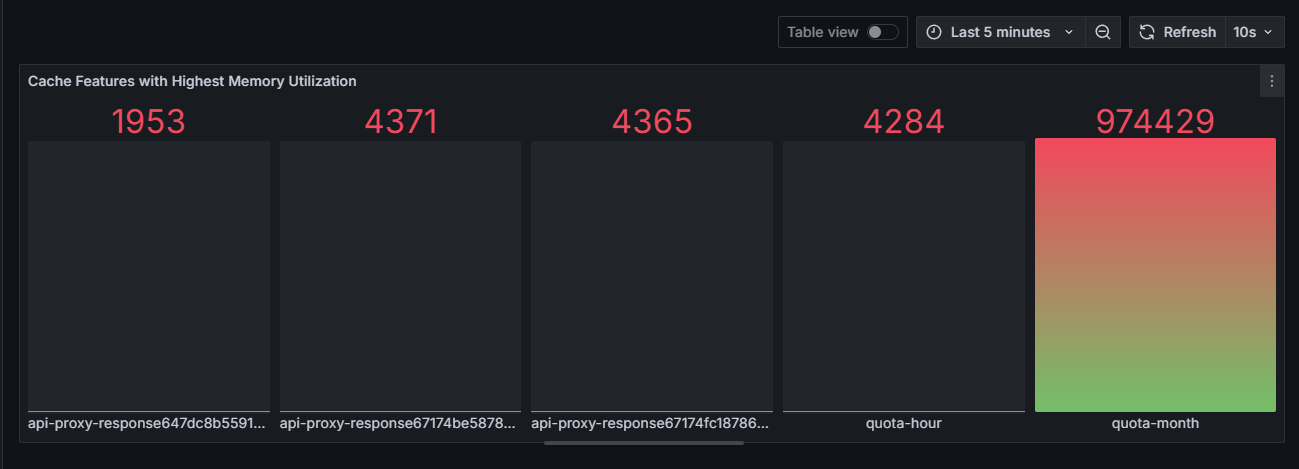
 ## Panel 2: Cache Features with Highest Memory Usage
```promql theme={null}
topk(5, sum by (cache) (cache_entry_memory_bytes))
```
**Visualization:** Bar gauge or Bar chart
## Panel 2: Cache Features with Highest Memory Usage
```promql theme={null}
topk(5, sum by (cache) (cache_entry_memory_bytes))
```
**Visualization:** Bar gauge or Bar chart
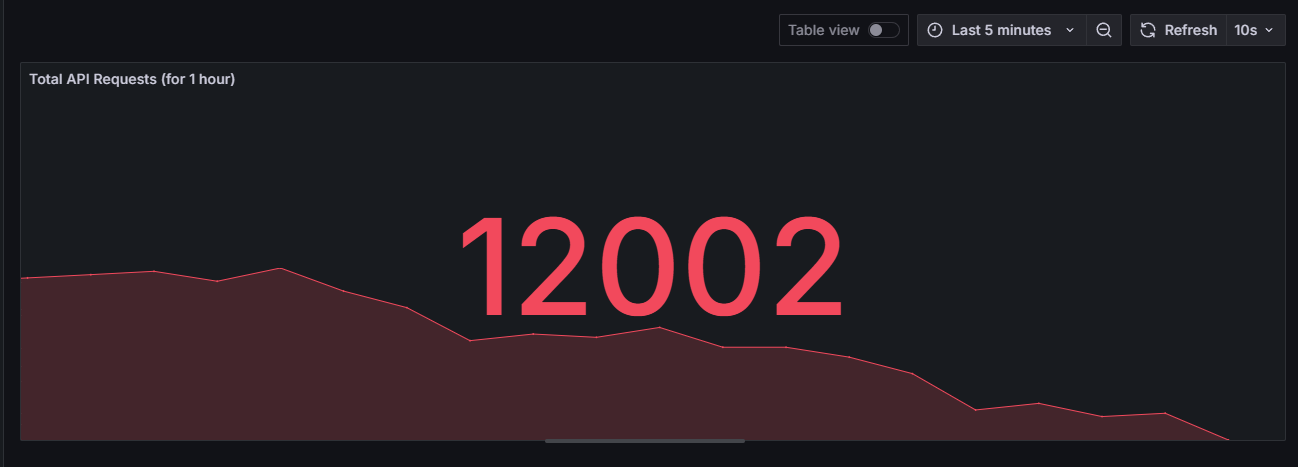
 ## Panel 3: Total API Requests (for 1 hour)
```promql theme={null}
sum(increase(apinizer_cache_api_requests_total[1h]))
```
**Visualization:** Bar chart or stat
## Panel 3: Total API Requests (for 1 hour)
```promql theme={null}
sum(increase(apinizer_cache_api_requests_total[1h]))
```
**Visualization:** Bar chart or stat