> ## Documentation Index
> Fetch the complete documentation index at: https://docs.apinizer.com/llms.txt
> Use this file to discover all available pages before exploring further.
# Grafana Installation and Prometheus Integration as Data Source
> You can install Grafana in Kubernetes environment and configure Prometheus as data source, ensure data persistence with PersistentVolume and PersistentVolumeClaim, and visualize metrics by creating dashboards.
## Grafana Installation
### Persistent Storage Configuration
Since Grafana's data will be stored on a node in Kubernetes cluster, **PersistentVolume (PV)** and **PersistentVolumeClaim (PVC)** definitions need to be made.
This configuration ensures Grafana preserves its data in case of shutdown or restart situations.
```yaml theme={null}
apiVersion: v1
kind: PersistentVolume
metadata:
name: grafana-pv
namespace: monitoring
spec:
capacity:
storage: 1Gi
accessModes:
- ReadWriteOnce
hostPath:
path: /mnt/data/grafana
persistentVolumeReclaimPolicy: Retain
---
apiVersion: v1
kind: PersistentVolumeClaim
metadata:
name: grafana-pvc
namespace: monitoring
spec:
accessModes:
- ReadWriteOnce
resources:
requests:
storage: 1Gi
```
The **PersistentVolume (PV) and PersistentVolumeClaim (PVC)** configuration above ensures Grafana stores its data on a specific node. However, the **hostPath** used here is dependent on the local file system of the specific node where Grafana runs.
**Therefore:**
* If Grafana pods are **moved to a different node**, they will **lose their data** unless the same **hostPath** directory exists on the new node.
* To guarantee pods always run on the same node, pods need to be pinned to specific nodes using **nodeAffinity** or **nodeSelector**.
Alternatively, **NFS, Ceph, Longhorn, or a cloud-based storage solution** can be used to store data in a **node-independent** manner.
### Grafana Secret Configuration
Password and password for admin user who will login to Grafana interface are determined:
```bash theme={null}
GF_SECURITY_ADMIN_USER=admin
GF_SECURITY_ADMIN_PASSWORD=
echo -n ${GF_SECURITY_ADMIN_USER} | base64
# We will put the output of this in place of variable in the next step
echo -n ${GF_SECURITY_ADMIN_PASSWORD} | base64
# We will put the output of this in place of variable in the next step
```
Username and password to be used in Grafana interface are stored with the secret given below.
```yaml theme={null}
apiVersion: v1
kind: Secret
metadata:
name: grafana-secrets
namespace: monitoring
type: Opaque
data:
GF_SECURITY_ADMIN_USER:
GF_SECURITY_ADMIN_PASSWORD:
```
### Grafana Deployment Configuration
Load the following Grafana Deployment YAML file to your Kubernetes Cluster by modifying it according to your systems.
Don't forget to replace `` value with your own node hostname.
```yaml theme={null}
apiVersion: apps/v1
kind: Deployment
metadata:
labels:
app: grafana
name: grafana
namespace: monitoring
spec:
replicas: 1
selector:
matchLabels:
app: grafana
template:
metadata:
labels:
app: grafana
spec:
affinity:
nodeAffinity:
requiredDuringSchedulingIgnoredDuringExecution:
nodeSelectorTerms:
- matchExpressions:
- key: kubernetes.io/hostname
operator: In
values:
-
initContainers:
- name: init-permissions
image: busybox
command: ["sh", "-c", "chown -R 472:472 /var/lib/grafana"]
volumeMounts:
- mountPath: /var/lib/grafana
name: grafana-storage
containers:
- name: grafana
image: grafana/grafana:11.6.1
imagePullPolicy: IfNotPresent
ports:
- containerPort: 3000
name: http-grafana
protocol: TCP
readinessProbe:
httpGet:
path: /api/health
port: 3000
scheme: HTTP
initialDelaySeconds: 10
periodSeconds: 30
successThreshold: 1
timeoutSeconds: 5
livenessProbe:
httpGet:
path: /api/health
port: 3000
scheme: HTTP
initialDelaySeconds: 30
periodSeconds: 10
successThreshold: 1
timeoutSeconds: 5
resources:
requests:
cpu: 256m
memory: 256Mi
envFrom:
- secretRef:
name: grafana-secrets
volumeMounts:
- mountPath: /var/lib/grafana
name: grafana-storage
volumes:
- name: grafana-storage
persistentVolumeClaim:
claimName: grafana-pvc
```
### Grafana Kubernetes Service
Kubernetes service for Grafana is created:
```yaml theme={null}
apiVersion: v1
kind: Service
metadata:
name: grafana
namespace: monitoring
labels:
app: grafana
spec:
ports:
- name: http
port: 3000
nodePort: 32181
selector:
app: grafana
type: NodePort
```
While Grafana is deployed on Kubernetes, it creates a Kubernetes service named grafana and of NodePort type. This service is necessary for accessing Grafana from outside Kubernetes. However, you can adapt it according to Ingress or whatever structure you use for connection method in your organization instead of this service.
## Setting Prometheus as Data Source on Grafana
**Login to Grafana**
Login to Grafana interface with admin user.
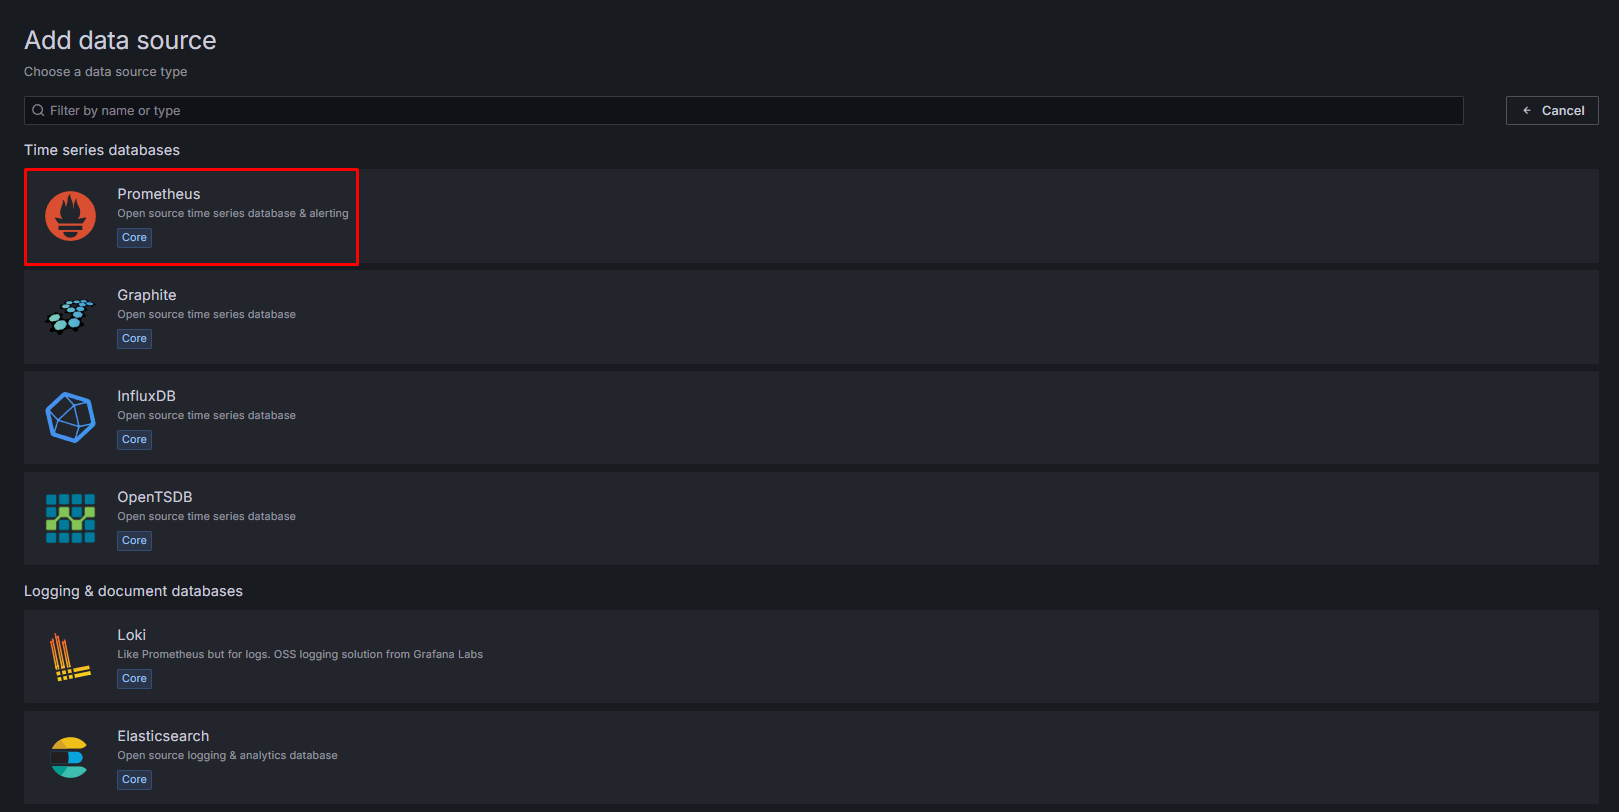
**Adding Data Source**
Click Data Source tab from Left Menu and select Add new data source option.
 **Prometheus Selection**
Prometheus is selected as data source. Prometheus Connection url and other necessary settings are entered and saved.
**Prometheus Selection**
Prometheus is selected as data source. Prometheus Connection url and other necessary settings are entered and saved.
 **Creating Dashboard**
Click Dashboard tab from Left Menu and select new dashboard option.
**Creating Dashboard**
Click Dashboard tab from Left Menu and select new dashboard option.
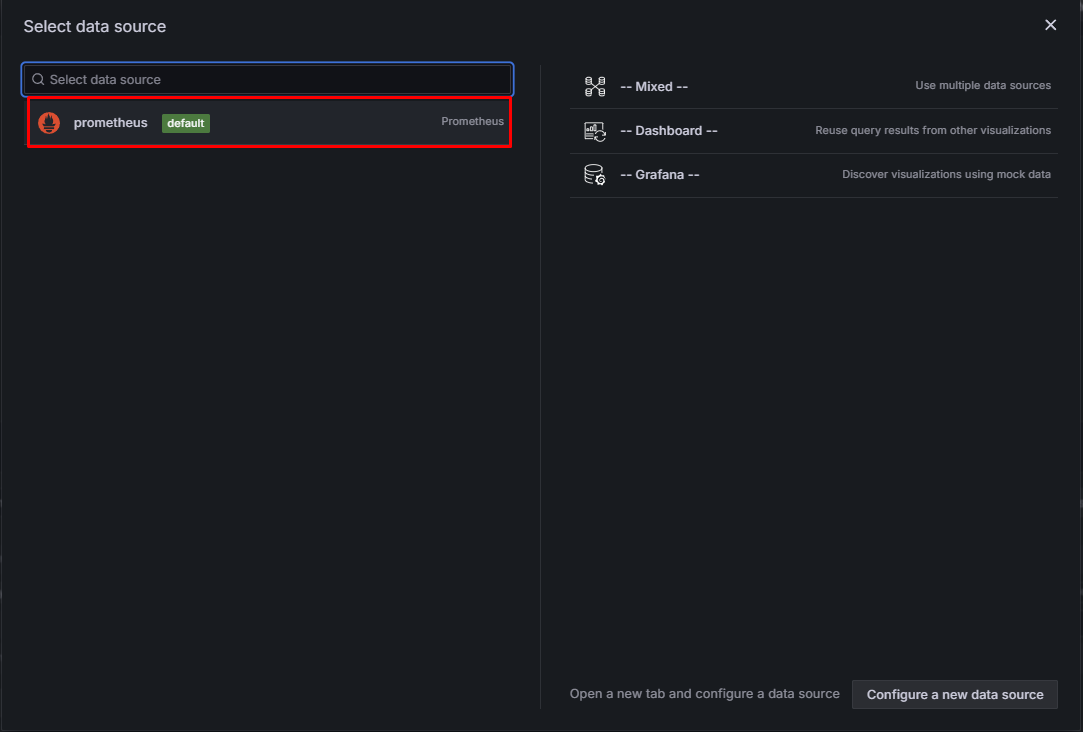
 **Data Source Selection**
New dashboard is created and prometheus is selected as data source.
**Data Source Selection**
New dashboard is created and prometheus is selected as data source.