> ## Documentation Index
> Fetch the complete documentation index at: https://docs.apinizer.com/llms.txt
> Use this file to discover all available pages before exploring further.
# Apinizer's Prometheus and Zabbix Integration: A Comprehensive Guide
> Stream Apinizer metrics through Prometheus into Zabbix to monitor, visualize, alert, and gain end-to-end operational visibility.
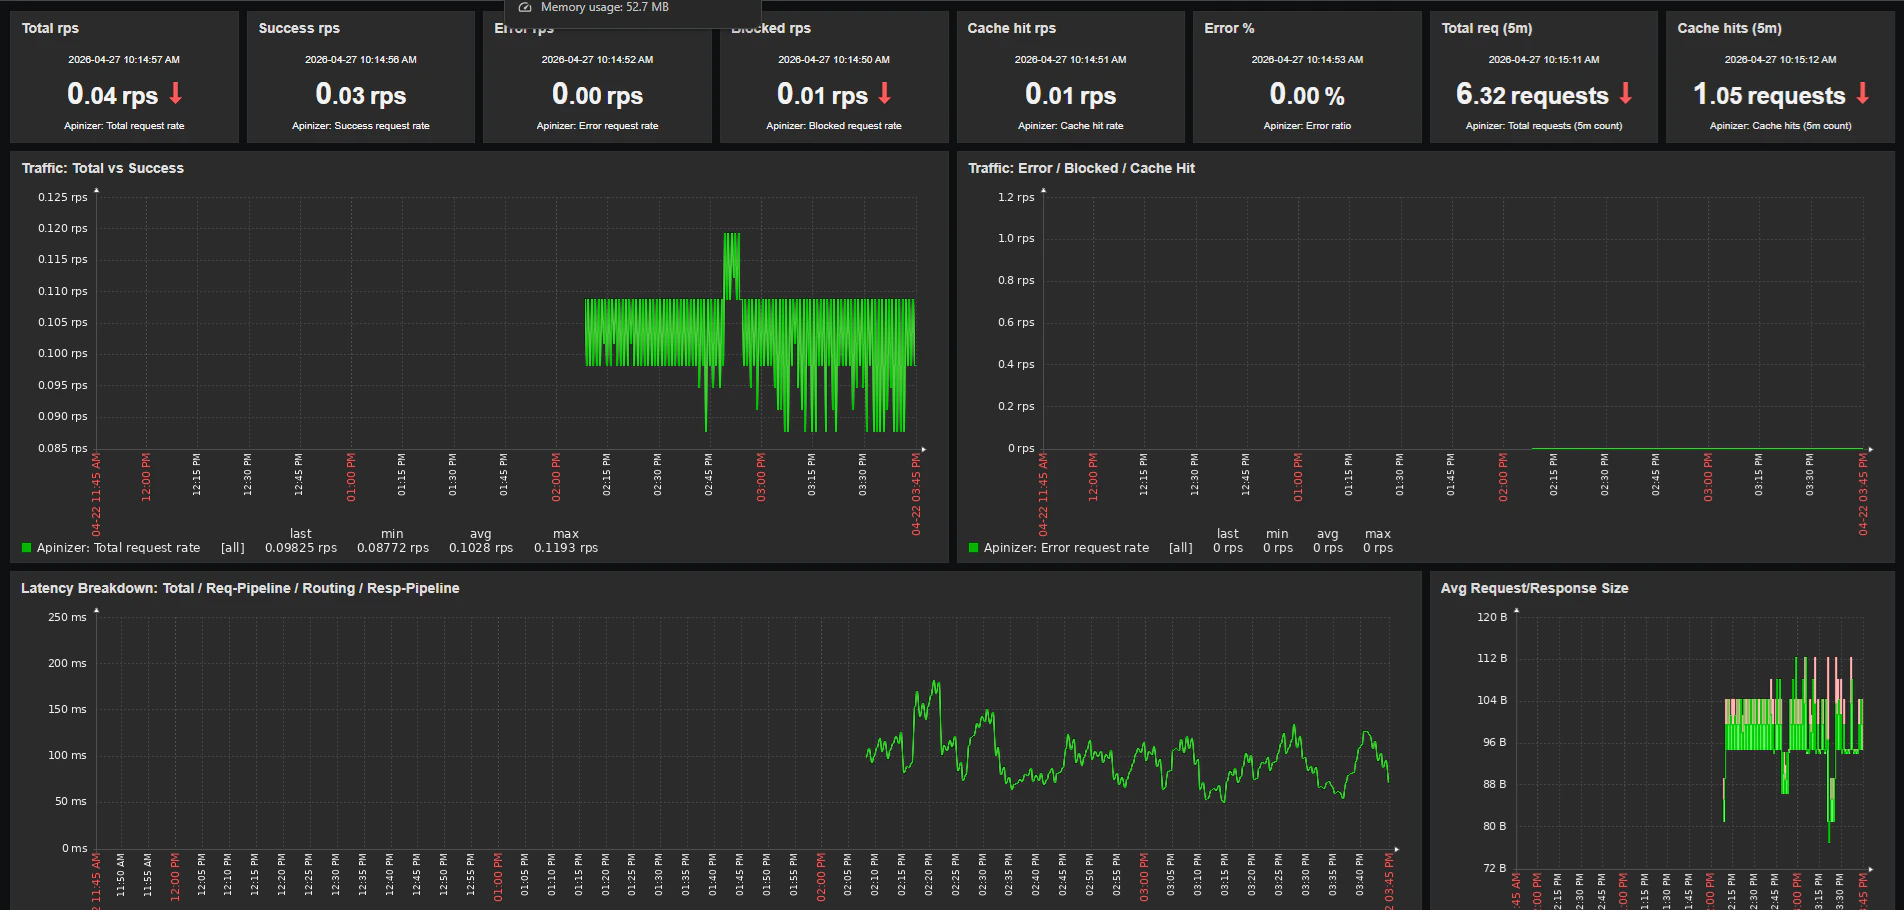 End-to-end monitoring is a critical requirement for API management platforms, both for performance and operational stability. Apinizer lets you integrate the rich set of metrics it publishes through Prometheus with the Zabbix monitoring platform that organizations already use. This article provides a step-by-step guide for collecting metrics from the Apinizer Gateway and Cache components through Prometheus and centralizing them in Zabbix for visualization, alarm configuration, and trend analysis.
# Overview of Apinizer's Metric System
End-to-end monitoring is a critical requirement for API management platforms, both for performance and operational stability. Apinizer lets you integrate the rich set of metrics it publishes through Prometheus with the Zabbix monitoring platform that organizations already use. This article provides a step-by-step guide for collecting metrics from the Apinizer Gateway and Cache components through Prometheus and centralizing them in Zabbix for visualization, alarm configuration, and trend analysis.
# Overview of Apinizer's Metric System
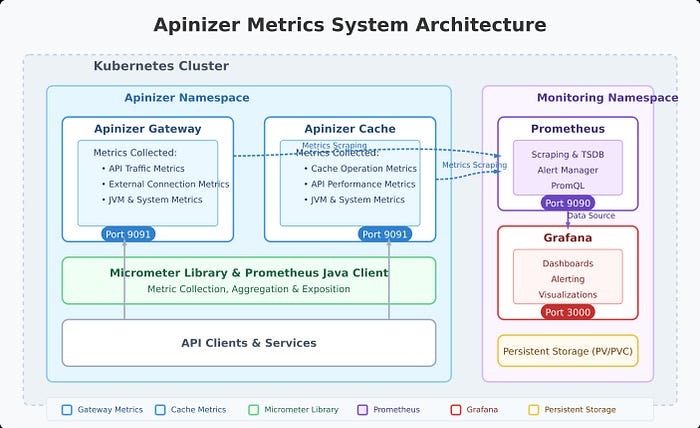 Apinizer's metric system is built on Micrometer and publishes metrics in Prometheus format. The platform collects a wide range of metrics across two main components:
1. **Apinizer Gateway**: Collects metrics related to API traffic, external connections, JVM health, and system resources
2. **Apinizer Cache**: Tracks cache operations, API requests, JVM performance, and system health
The Zabbix integration collects these metrics by querying Prometheus's `/api/v1/query` REST API through the **HTTP Agent** item type. This way, your existing Prometheus infrastructure becomes a Zabbix data source without the need for an additional Zabbix-Prometheus plugin.
# Metrics Collected by Apinizer
Apinizer's metric system is built on Micrometer and publishes metrics in Prometheus format. The platform collects a wide range of metrics across two main components:
1. **Apinizer Gateway**: Collects metrics related to API traffic, external connections, JVM health, and system resources
2. **Apinizer Cache**: Tracks cache operations, API requests, JVM performance, and system health
The Zabbix integration collects these metrics by querying Prometheus's `/api/v1/query` REST API through the **HTTP Agent** item type. This way, your existing Prometheus infrastructure becomes a Zabbix data source without the need for an additional Zabbix-Prometheus plugin.
# Metrics Collected by Apinizer
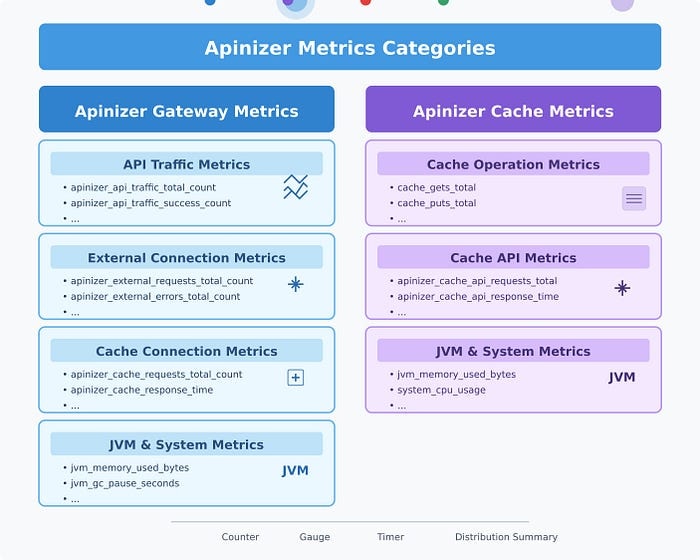 # Apinizer Gateway Metrics
The Gateway component collects metrics across several categories:
## API Traffic Metrics
These metrics track requests passing through the Apinizer Gateway:
* Total API traffic requests
* Successful/failed/blocked API requests
* Request processing times (pipeline, routing, total)
* Request and response sizes
* Cache hit statistics
Each metric is available in two forms:
* Aggregate metrics (e.g., total API requests across all APIs)
* Tagged metrics with detailed dimensions (e.g., requests per API ID, per API name)
## External Connection Metrics
These track connections made to external services:
* Total external requests
* External error counts
* External response times
## JVM Metrics
These provide insights into the Java Virtual Machine:
* Memory usage (heap, non-heap)
* Garbage collection statistics
* Thread counts and states
## System Metrics
These monitor the underlying system:
* CPU usage
* Processor count
* System load average
* File descriptor counts
# Apinizer Cache Metrics
The Cache component collects:
## Cache Operation Metrics
* Cache get/put counts
* Cache size and entry counts
* Cache operation latencies
* Memory usage by cache entries
## API Metrics
* API request counts
* API response times
* API error counts
## JVM and System Metrics
Similar to the Gateway, the Cache component also tracks JVM performance and system resource usage.
# Setting Up the Zabbix Integration
## 1. Enabling Metrics on Apinizer Components
### For Apinizer Gateway:
Edit the worker deployment and add the `METRICS_ENABLED=true` environment variable. The container spec also needs port 9091 to be added.
```bash theme={null}
# Add the environment variable
kubectl -n set env deployment/worker METRICS_ENABLED=true
# Add container port 9091
kubectl -n patch deployment worker --type=json -p='[
{
"op": "add",
"path": "/spec/template/spec/containers/0/ports/-",
"value": {"containerPort": 9091, "name": "metrics", "protocol": "TCP"}
}
]'
```
### For Apinizer Cache:
Edit the cache deployment and add the `METRICS_ENABLED=true` environment variable.
Through the Kubernetes CLI:
```bash theme={null}
kubectl edit deploy -n cache
# Add the following environment variable
- name: METRICS_ENABLED
value: "true"
```
## 2. Configuring Prometheus
For Apinizer pods to be scraped by Prometheus, you need to add annotations to the worker and cache deployments and configure Prometheus to discover those pods.
### Add pod annotations:
```yaml theme={null}
template:
metadata:
annotations:
prometheus.io/scrape: "true"
prometheus.io/port: "9091"
prometheus.io/path: "/metrics"
```
### Extend the Prometheus scrape config to cover the Apinizer namespaces:
```yaml theme={null}
scrape_configs:
- job_name: 'kubernetes-pods'
kubernetes_sd_configs:
- role: pod
relabel_configs:
- source_labels: [__meta_kubernetes_pod_annotation_prometheus_io_scrape]
action: keep
regex: true
- source_labels: [__meta_kubernetes_namespace]
action: keep
regex: tester|prod|uat # Add the namespaces where Apinizer runs
- source_labels: [__meta_kubernetes_pod_annotation_prometheus_io_port, __meta_kubernetes_pod_ip]
action: replace
regex: (\d+);((([0-9]+?)(\.|$)){4})
replacement: $2:$1
target_label: __address__
```
After the configuration change, restart Prometheus:
```bash theme={null}
kubectl -n monitoring rollout restart deployment/prometheus
```
## 3. Making Prometheus Reachable from Zabbix
The Zabbix Server needs to reach the Prometheus HTTP endpoint. The simplest method is to expose it via NodePort:
```yaml theme={null}
apiVersion: v1
kind: Service
metadata:
name: prometheus-service
namespace: monitoring
spec:
type: NodePort
ports:
- port: 9090
targetPort: 9090
nodePort: 30190
selector:
app: prometheus
```
Verify the connection from the Zabbix Server:
```bash theme={null}
curl -s http://:30190/-/healthy
# Expected: Prometheus Server is Healthy.
```
## 4. Preparing the Zabbix Side
### Zabbix Agent installation
Install the Zabbix Agent on the Kubernetes node where Apinizer runs. This way, host-level metrics (CPU, RAM, disk) are collected alongside Apinizer metrics:
```bash theme={null}
wget https://repo.zabbix.com/zabbix/7.0/ubuntu/pool/main/z/zabbix-release/zabbix-release_7.0-2+ubuntu24.04_all.deb
dpkg -i zabbix-release_7.0-2+ubuntu24.04_all.deb
apt update && apt install -y zabbix-agent
# In /etc/zabbix/zabbix_agentd.conf:
# Server=
# Hostname=
systemctl enable --now zabbix-agent
```
### Import the Zabbix Template
The HTTP Agent-based template prepared for Apinizer (41 items, 8 triggers, 9 macros) is imported through the Zabbix interface:
From **Data collection → Templates → Import**, select the `apinizer_by_prometheus.yaml` file. Under Advanced options, check Update existing, Create new, and Delete missing for all categories, then click Import.
### Create a host and configure macros
Create a Zabbix host for the Apinizer environment:
* Host name: `` (same as the Zabbix Agent)
* Templates: `Linux by Zabbix agent` and `Apinizer by Prometheus`
* Macros (override from the Inherited and host macros tab):
* `{$PROM.URL}` → `http://:30190`
* `{$PROM.NAMESPACE}` → `tester` (or the target namespace)
# Analyzing Apinizer Metrics with PromQL
Zabbix HTTP Agent items send PromQL queries to the Prometheus `/api/v1/query` endpoint and extract the value from the JSON response using JSONPath. The queries below are both the queries the template uses internally and examples you can use when defining a new item in Zabbix:
## Gateway API Traffic Analysis
```promql theme={null}
# Total API request rate over the last 5 minutes
sum(rate(apinizer_api_traffic_total_count_total{application="apinizer"}[5m]))
# Successful request ratio (%)
(sum(rate(apinizer_api_traffic_success_count_total{application="apinizer"}[5m])) / sum(rate(apinizer_api_traffic_total_count_total{application="apinizer"}[5m]))) * 100
# Average response time (milliseconds)
1000 * sum(rate(apinizer_api_traffic_total_time_seconds_sum{application="apinizer"}[5m])) / sum(rate(apinizer_api_traffic_total_time_seconds_count{application="apinizer"}[5m]))
```
## Cache Performance Analysis
```promql theme={null}
# Cache operation error rate seen by the worker
sum(rate(apinizer_cache_errors_total_count_total{application="apinizer"}[5m]))
# JVM heap usage of the cache pod (%)
(sum(jvm_memory_used_bytes{application="apinizer-cache",area="heap"}) / sum(jvm_memory_max_bytes{application="apinizer-cache",area="heap"})) * 100
# Thread count of the cache pod
sum(jvm_threads_live_threads{application="apinizer-cache"})
```
## JVM Analysis
```promql theme={null}
# Worker memory usage (%)
(sum(jvm_memory_used_bytes{application="apinizer",area="heap"}) / sum(jvm_memory_max_bytes{application="apinizer",area="heap"})) * 100
# Garbage collection time (seconds/second)
sum(rate(jvm_gc_pause_seconds_sum{application="apinizer"}[5m]))
```
# Creating Zabbix Dashboards
Zabbix dashboards can be created in a single shot through a Python script using the `dashboard.create` API call. With the prepared script, a 5-page, 72-widget dashboard is produced in one API call. The contents of each page are summarized below.
**Panel 1: Apinizer UP**
* Item: `Apinizer apimanager availability` (TCP service check)
* Visualization: Item value (1 = up, 0 = down)
**Panel 2: API Success Rate Gauge**
* Metric: `(sum(rate(apinizer_api_traffic_success_count_total[5m])) / sum(rate(apinizer_api_traffic_total_count_total[5m]))) * 100`
* Visualization: Gauge (green 95+, yellow 90-95, red below 90)
**Panel 3: API Blocked Rate Gauge**
* Metric: blocked / total \* 100
* Visualization: Gauge (yellow 10+, red 30+)
**Panel 4: Cache Hit Rate Gauge**
* Metric: cache\_hits / total \* 100
* Visualization: Gauge (blue tones)
**Panel 5: Request Rate Trend**
* Metrics: total / success / error / blocked rates
* Visualization: Graph (classic), 4 lines
**Panel 6: Active Problems**
* All active triggers attached to the host
* Visualization: Problems widget
# Traffic & Latency Page
**Panel 1: Latency Breakdown**
* Metrics:
* Total response time: `1000 * sum(rate(apinizer_api_traffic_total_time_seconds_sum[5m])) / sum(rate(apinizer_api_traffic_total_time_seconds_count[5m]))`
* Request pipeline: same formula with `request_pipeline_time_seconds`
* Routing: same formula with `routing_time_seconds`
* Response pipeline: same formula with `response_pipeline_time_seconds`
* Visualization: Graph (classic), 4 lines
**Panel 2: Request/Response Size**
* Request size: `sum(rate(apinizer_api_traffic_request_size_bytes_sum[5m])) / sum(rate(apinizer_api_traffic_request_size_bytes_count[5m]))`
* Response size: `sum(rate(apinizer_api_traffic_response_size_bytes_sum[5m])) / sum(rate(apinizer_api_traffic_response_size_bytes_count[5m]))`
* Visualization: Graph (classic)
**Panel 3: Total Requests in 5 minutes**
* Metric: `sum(increase(apinizer_api_traffic_total_count_total[5m]))`
* Visualization: Item value
# JVM & Infrastructure Page
**Panel 1: JVM Heap %**
* Metric: `sum(jvm_memory_used_bytes{area="heap"}) / sum(jvm_memory_max_bytes{area="heap"}) * 100`
* Visualization: Gauge (yellow 70+, red 85+)
**Panel 2: Heap Used (MB) - Multi-Worker Comparison**
* Metric 1 (tester): `sum(jvm_memory_used_bytes{namespace="tester",application="apinizer",area="heap"}) / 1024 / 1024`
* Metric 2 (zwebsocket): same query with a different namespace
* Visualization: Graph (classic), 2 lines in different colors
**Panel 3: GC Pause Rate**
* Metric: `sum(rate(jvm_gc_pause_seconds_sum[5m]))`
* Visualization: Graph (classic)
**Panel 4: HTTP Pool Utilization**
* Metric: `sum(httpcomponents_httpclient_pool_total_connections) / sum(httpcomponents_httpclient_pool_total_max) * 100`
* Visualization: Gauge
**Panel 5: External (Backend) Request vs Error Rate**
* Metrics:
* Backend request rate: `sum(rate(apinizer_external_requests_total_count_total[5m]))`
* Backend error rate: `sum(rate(apinizer_external_errors_total_count_total[5m]))`
* Visualization: Graph (classic)
# Cache Pod Page
**Panel 1: Cache Pod Heap %**
* Metric: `sum(jvm_memory_used_bytes{application="apinizer-cache",area="heap"}) / sum(jvm_memory_max_bytes{application="apinizer-cache",area="heap"}) * 100`
* Visualization: Gauge
**Panel 2: Cache Pod Threads**
* Metric: `sum(jvm_threads_live_threads{application="apinizer-cache"})`
* Visualization: Item value
**Panel 3: Worker-side Cache Operation Errors**
* Metric: `sum(rate(apinizer_cache_errors_total_count_total[5m]))`
* Visualization: Graph (classic)
# Host Health Page
This page shows OS-level metrics of the Kubernetes node where Apinizer runs. The data comes from the `Linux by Zabbix agent` template; it is collected directly from the Zabbix Agent, not through Prometheus.
**Panel 1: CPU Utilization**
* Item: `system.cpu.util` from the Linux template
* Visualization: Gauge and Graph (classic)
**Panel 2: Memory Utilization**
* Item: `vm.memory.utilization`
* Visualization: Gauge and Graph (classic)
**Panel 3: Load Average (1m)**
* Item: `system.cpu.load[all,avg1]`
* Visualization: Graph (classic)
# Zabbix Triggers (Alarms)
The Apinizer template ships with 8 triggers by default. Each trigger takes its threshold from a separate macro, so it can be customized per host:
| Trigger | Default Threshold | Macro |
| :--------------------------------- | :---------------- | :---------------------------- |
| High error ratio (5m) | 5% | `{$APINIZER.ERROR_RATIO.MAX}` |
| High total response time (5m) | 2000 ms | `{$APINIZER.LATENCY.MAX}` |
| High backend error rate (5m) | 1 rps | `{$APINIZER.EXT_ERROR.MAX}` |
| High JVM heap usage (5m) | 85% | `{$APINIZER.HEAP.MAX}` |
| High GC pressure (5m) | 0.1 s/s | `{$APINIZER.GC.MAX}` |
| HTTP pool saturated (5m) | 90% | `{$APINIZER.POOL.MAX}` |
| No traffic metric data (nodata 5m) | n/a | (no override) |
| Blocked request spike (5m) | 10 rps | `{$APINIZER.BLOCKED.MAX}` |
When triggers fire, they can be routed to email, Slack, SMS, PagerDuty, or webhook notification channels through Zabbix's **Alerts → Actions → Trigger actions** menu.
# Best Practices
# 1. Metric Retention
On the Zabbix side, history (raw data) and trends (hourly aggregation) durations are configured separately per item. The Apinizer template uses these defaults:
* History: 30 days
* Trends: 365 days
For longer retention, make sure history/trends partitions in the Zabbix configuration have sufficient storage. On the Prometheus side, additionally:
```
--storage.tsdb.path=/prometheus
--storage.tsdb.retention.time=15d
```
adjust these values to your needs.
# 2. Multi-Environment Configuration
When Apinizer runs in multiple namespaces (tester, uat, prod), create a separate Zabbix host for each environment. Attach the same `Apinizer by Prometheus` template to each host and override the `{$PROM.NAMESPACE}` macro at the host level to point to the target namespace. This way:
* Each environment's metrics stay isolated
* A separate dashboard can be produced per environment
* Trigger thresholds can be differentiated per environment (e.g., 2% error ratio in prod, 10% in test)
# 3. Multi-Worker Comparison on the Same Dashboard
To compare two workers (for example, during a canary release) on the same dashboard, additional items pointing to the second worker's namespace are added to the template. On the JVM & Infrastructure page, both workers' lines are drawn in the same Heap, Threads, GC, and CPU graphs in different colors. This is the fastest visual method for performance comparison.
# 4. Label Usage
Every metric series Apinizer emits carries the following labels:
* `namespace` — the Kubernetes namespace of the pod
* `pod` — the pod name (changes on restart)
* `application` — apinizer (worker) or apinizer-cache (cache pod)
* `environment` — Apinizer's internal environment identifier
In the PromQL queries used by Zabbix items, in particular use the `application="apinizer"` filter; otherwise, the `sum()` function will aggregate worker and cache metrics together and the result will be misleading.
# Conclusion
Integrating Apinizer with Zabbix through Prometheus brings Apinizer-specific visibility into the operational monitoring platform that organizations already use. Metric collection is performed by Prometheus; Zabbix HTTP Agent items query those metrics and incorporate them into Zabbix's own history/trends/dashboard/trigger ecosystem.
This integration leverages the strengths of each component:
* Apinizer's comprehensive metric collection capability
* Prometheus's efficient time-series database and PromQL query language
* Zabbix's mature trigger, escalation, and notification routing capabilities
* The ability of the Zabbix Agent to combine OS-level host metrics with Apinizer metrics on the same dashboard
Set up the integration today to start monitoring your Apinizer environment end to end and centralize your operational data.
# Resources
For more information:
* Apinizer Documentation
* Prometheus Documentation
* Zabbix Documentation
# Apinizer Gateway Metrics
The Gateway component collects metrics across several categories:
## API Traffic Metrics
These metrics track requests passing through the Apinizer Gateway:
* Total API traffic requests
* Successful/failed/blocked API requests
* Request processing times (pipeline, routing, total)
* Request and response sizes
* Cache hit statistics
Each metric is available in two forms:
* Aggregate metrics (e.g., total API requests across all APIs)
* Tagged metrics with detailed dimensions (e.g., requests per API ID, per API name)
## External Connection Metrics
These track connections made to external services:
* Total external requests
* External error counts
* External response times
## JVM Metrics
These provide insights into the Java Virtual Machine:
* Memory usage (heap, non-heap)
* Garbage collection statistics
* Thread counts and states
## System Metrics
These monitor the underlying system:
* CPU usage
* Processor count
* System load average
* File descriptor counts
# Apinizer Cache Metrics
The Cache component collects:
## Cache Operation Metrics
* Cache get/put counts
* Cache size and entry counts
* Cache operation latencies
* Memory usage by cache entries
## API Metrics
* API request counts
* API response times
* API error counts
## JVM and System Metrics
Similar to the Gateway, the Cache component also tracks JVM performance and system resource usage.
# Setting Up the Zabbix Integration
## 1. Enabling Metrics on Apinizer Components
### For Apinizer Gateway:
Edit the worker deployment and add the `METRICS_ENABLED=true` environment variable. The container spec also needs port 9091 to be added.
```bash theme={null}
# Add the environment variable
kubectl -n set env deployment/worker METRICS_ENABLED=true
# Add container port 9091
kubectl -n patch deployment worker --type=json -p='[
{
"op": "add",
"path": "/spec/template/spec/containers/0/ports/-",
"value": {"containerPort": 9091, "name": "metrics", "protocol": "TCP"}
}
]'
```
### For Apinizer Cache:
Edit the cache deployment and add the `METRICS_ENABLED=true` environment variable.
Through the Kubernetes CLI:
```bash theme={null}
kubectl edit deploy -n cache
# Add the following environment variable
- name: METRICS_ENABLED
value: "true"
```
## 2. Configuring Prometheus
For Apinizer pods to be scraped by Prometheus, you need to add annotations to the worker and cache deployments and configure Prometheus to discover those pods.
### Add pod annotations:
```yaml theme={null}
template:
metadata:
annotations:
prometheus.io/scrape: "true"
prometheus.io/port: "9091"
prometheus.io/path: "/metrics"
```
### Extend the Prometheus scrape config to cover the Apinizer namespaces:
```yaml theme={null}
scrape_configs:
- job_name: 'kubernetes-pods'
kubernetes_sd_configs:
- role: pod
relabel_configs:
- source_labels: [__meta_kubernetes_pod_annotation_prometheus_io_scrape]
action: keep
regex: true
- source_labels: [__meta_kubernetes_namespace]
action: keep
regex: tester|prod|uat # Add the namespaces where Apinizer runs
- source_labels: [__meta_kubernetes_pod_annotation_prometheus_io_port, __meta_kubernetes_pod_ip]
action: replace
regex: (\d+);((([0-9]+?)(\.|$)){4})
replacement: $2:$1
target_label: __address__
```
After the configuration change, restart Prometheus:
```bash theme={null}
kubectl -n monitoring rollout restart deployment/prometheus
```
## 3. Making Prometheus Reachable from Zabbix
The Zabbix Server needs to reach the Prometheus HTTP endpoint. The simplest method is to expose it via NodePort:
```yaml theme={null}
apiVersion: v1
kind: Service
metadata:
name: prometheus-service
namespace: monitoring
spec:
type: NodePort
ports:
- port: 9090
targetPort: 9090
nodePort: 30190
selector:
app: prometheus
```
Verify the connection from the Zabbix Server:
```bash theme={null}
curl -s http://:30190/-/healthy
# Expected: Prometheus Server is Healthy.
```
## 4. Preparing the Zabbix Side
### Zabbix Agent installation
Install the Zabbix Agent on the Kubernetes node where Apinizer runs. This way, host-level metrics (CPU, RAM, disk) are collected alongside Apinizer metrics:
```bash theme={null}
wget https://repo.zabbix.com/zabbix/7.0/ubuntu/pool/main/z/zabbix-release/zabbix-release_7.0-2+ubuntu24.04_all.deb
dpkg -i zabbix-release_7.0-2+ubuntu24.04_all.deb
apt update && apt install -y zabbix-agent
# In /etc/zabbix/zabbix_agentd.conf:
# Server=
# Hostname=
systemctl enable --now zabbix-agent
```
### Import the Zabbix Template
The HTTP Agent-based template prepared for Apinizer (41 items, 8 triggers, 9 macros) is imported through the Zabbix interface:
From **Data collection → Templates → Import**, select the `apinizer_by_prometheus.yaml` file. Under Advanced options, check Update existing, Create new, and Delete missing for all categories, then click Import.
### Create a host and configure macros
Create a Zabbix host for the Apinizer environment:
* Host name: `` (same as the Zabbix Agent)
* Templates: `Linux by Zabbix agent` and `Apinizer by Prometheus`
* Macros (override from the Inherited and host macros tab):
* `{$PROM.URL}` → `http://:30190`
* `{$PROM.NAMESPACE}` → `tester` (or the target namespace)
# Analyzing Apinizer Metrics with PromQL
Zabbix HTTP Agent items send PromQL queries to the Prometheus `/api/v1/query` endpoint and extract the value from the JSON response using JSONPath. The queries below are both the queries the template uses internally and examples you can use when defining a new item in Zabbix:
## Gateway API Traffic Analysis
```promql theme={null}
# Total API request rate over the last 5 minutes
sum(rate(apinizer_api_traffic_total_count_total{application="apinizer"}[5m]))
# Successful request ratio (%)
(sum(rate(apinizer_api_traffic_success_count_total{application="apinizer"}[5m])) / sum(rate(apinizer_api_traffic_total_count_total{application="apinizer"}[5m]))) * 100
# Average response time (milliseconds)
1000 * sum(rate(apinizer_api_traffic_total_time_seconds_sum{application="apinizer"}[5m])) / sum(rate(apinizer_api_traffic_total_time_seconds_count{application="apinizer"}[5m]))
```
## Cache Performance Analysis
```promql theme={null}
# Cache operation error rate seen by the worker
sum(rate(apinizer_cache_errors_total_count_total{application="apinizer"}[5m]))
# JVM heap usage of the cache pod (%)
(sum(jvm_memory_used_bytes{application="apinizer-cache",area="heap"}) / sum(jvm_memory_max_bytes{application="apinizer-cache",area="heap"})) * 100
# Thread count of the cache pod
sum(jvm_threads_live_threads{application="apinizer-cache"})
```
## JVM Analysis
```promql theme={null}
# Worker memory usage (%)
(sum(jvm_memory_used_bytes{application="apinizer",area="heap"}) / sum(jvm_memory_max_bytes{application="apinizer",area="heap"})) * 100
# Garbage collection time (seconds/second)
sum(rate(jvm_gc_pause_seconds_sum{application="apinizer"}[5m]))
```
# Creating Zabbix Dashboards
Zabbix dashboards can be created in a single shot through a Python script using the `dashboard.create` API call. With the prepared script, a 5-page, 72-widget dashboard is produced in one API call. The contents of each page are summarized below.
**Panel 1: Apinizer UP**
* Item: `Apinizer apimanager availability` (TCP service check)
* Visualization: Item value (1 = up, 0 = down)
**Panel 2: API Success Rate Gauge**
* Metric: `(sum(rate(apinizer_api_traffic_success_count_total[5m])) / sum(rate(apinizer_api_traffic_total_count_total[5m]))) * 100`
* Visualization: Gauge (green 95+, yellow 90-95, red below 90)
**Panel 3: API Blocked Rate Gauge**
* Metric: blocked / total \* 100
* Visualization: Gauge (yellow 10+, red 30+)
**Panel 4: Cache Hit Rate Gauge**
* Metric: cache\_hits / total \* 100
* Visualization: Gauge (blue tones)
**Panel 5: Request Rate Trend**
* Metrics: total / success / error / blocked rates
* Visualization: Graph (classic), 4 lines
**Panel 6: Active Problems**
* All active triggers attached to the host
* Visualization: Problems widget
# Traffic & Latency Page
**Panel 1: Latency Breakdown**
* Metrics:
* Total response time: `1000 * sum(rate(apinizer_api_traffic_total_time_seconds_sum[5m])) / sum(rate(apinizer_api_traffic_total_time_seconds_count[5m]))`
* Request pipeline: same formula with `request_pipeline_time_seconds`
* Routing: same formula with `routing_time_seconds`
* Response pipeline: same formula with `response_pipeline_time_seconds`
* Visualization: Graph (classic), 4 lines
**Panel 2: Request/Response Size**
* Request size: `sum(rate(apinizer_api_traffic_request_size_bytes_sum[5m])) / sum(rate(apinizer_api_traffic_request_size_bytes_count[5m]))`
* Response size: `sum(rate(apinizer_api_traffic_response_size_bytes_sum[5m])) / sum(rate(apinizer_api_traffic_response_size_bytes_count[5m]))`
* Visualization: Graph (classic)
**Panel 3: Total Requests in 5 minutes**
* Metric: `sum(increase(apinizer_api_traffic_total_count_total[5m]))`
* Visualization: Item value
# JVM & Infrastructure Page
**Panel 1: JVM Heap %**
* Metric: `sum(jvm_memory_used_bytes{area="heap"}) / sum(jvm_memory_max_bytes{area="heap"}) * 100`
* Visualization: Gauge (yellow 70+, red 85+)
**Panel 2: Heap Used (MB) - Multi-Worker Comparison**
* Metric 1 (tester): `sum(jvm_memory_used_bytes{namespace="tester",application="apinizer",area="heap"}) / 1024 / 1024`
* Metric 2 (zwebsocket): same query with a different namespace
* Visualization: Graph (classic), 2 lines in different colors
**Panel 3: GC Pause Rate**
* Metric: `sum(rate(jvm_gc_pause_seconds_sum[5m]))`
* Visualization: Graph (classic)
**Panel 4: HTTP Pool Utilization**
* Metric: `sum(httpcomponents_httpclient_pool_total_connections) / sum(httpcomponents_httpclient_pool_total_max) * 100`
* Visualization: Gauge
**Panel 5: External (Backend) Request vs Error Rate**
* Metrics:
* Backend request rate: `sum(rate(apinizer_external_requests_total_count_total[5m]))`
* Backend error rate: `sum(rate(apinizer_external_errors_total_count_total[5m]))`
* Visualization: Graph (classic)
# Cache Pod Page
**Panel 1: Cache Pod Heap %**
* Metric: `sum(jvm_memory_used_bytes{application="apinizer-cache",area="heap"}) / sum(jvm_memory_max_bytes{application="apinizer-cache",area="heap"}) * 100`
* Visualization: Gauge
**Panel 2: Cache Pod Threads**
* Metric: `sum(jvm_threads_live_threads{application="apinizer-cache"})`
* Visualization: Item value
**Panel 3: Worker-side Cache Operation Errors**
* Metric: `sum(rate(apinizer_cache_errors_total_count_total[5m]))`
* Visualization: Graph (classic)
# Host Health Page
This page shows OS-level metrics of the Kubernetes node where Apinizer runs. The data comes from the `Linux by Zabbix agent` template; it is collected directly from the Zabbix Agent, not through Prometheus.
**Panel 1: CPU Utilization**
* Item: `system.cpu.util` from the Linux template
* Visualization: Gauge and Graph (classic)
**Panel 2: Memory Utilization**
* Item: `vm.memory.utilization`
* Visualization: Gauge and Graph (classic)
**Panel 3: Load Average (1m)**
* Item: `system.cpu.load[all,avg1]`
* Visualization: Graph (classic)
# Zabbix Triggers (Alarms)
The Apinizer template ships with 8 triggers by default. Each trigger takes its threshold from a separate macro, so it can be customized per host:
| Trigger | Default Threshold | Macro |
| :--------------------------------- | :---------------- | :---------------------------- |
| High error ratio (5m) | 5% | `{$APINIZER.ERROR_RATIO.MAX}` |
| High total response time (5m) | 2000 ms | `{$APINIZER.LATENCY.MAX}` |
| High backend error rate (5m) | 1 rps | `{$APINIZER.EXT_ERROR.MAX}` |
| High JVM heap usage (5m) | 85% | `{$APINIZER.HEAP.MAX}` |
| High GC pressure (5m) | 0.1 s/s | `{$APINIZER.GC.MAX}` |
| HTTP pool saturated (5m) | 90% | `{$APINIZER.POOL.MAX}` |
| No traffic metric data (nodata 5m) | n/a | (no override) |
| Blocked request spike (5m) | 10 rps | `{$APINIZER.BLOCKED.MAX}` |
When triggers fire, they can be routed to email, Slack, SMS, PagerDuty, or webhook notification channels through Zabbix's **Alerts → Actions → Trigger actions** menu.
# Best Practices
# 1. Metric Retention
On the Zabbix side, history (raw data) and trends (hourly aggregation) durations are configured separately per item. The Apinizer template uses these defaults:
* History: 30 days
* Trends: 365 days
For longer retention, make sure history/trends partitions in the Zabbix configuration have sufficient storage. On the Prometheus side, additionally:
```
--storage.tsdb.path=/prometheus
--storage.tsdb.retention.time=15d
```
adjust these values to your needs.
# 2. Multi-Environment Configuration
When Apinizer runs in multiple namespaces (tester, uat, prod), create a separate Zabbix host for each environment. Attach the same `Apinizer by Prometheus` template to each host and override the `{$PROM.NAMESPACE}` macro at the host level to point to the target namespace. This way:
* Each environment's metrics stay isolated
* A separate dashboard can be produced per environment
* Trigger thresholds can be differentiated per environment (e.g., 2% error ratio in prod, 10% in test)
# 3. Multi-Worker Comparison on the Same Dashboard
To compare two workers (for example, during a canary release) on the same dashboard, additional items pointing to the second worker's namespace are added to the template. On the JVM & Infrastructure page, both workers' lines are drawn in the same Heap, Threads, GC, and CPU graphs in different colors. This is the fastest visual method for performance comparison.
# 4. Label Usage
Every metric series Apinizer emits carries the following labels:
* `namespace` — the Kubernetes namespace of the pod
* `pod` — the pod name (changes on restart)
* `application` — apinizer (worker) or apinizer-cache (cache pod)
* `environment` — Apinizer's internal environment identifier
In the PromQL queries used by Zabbix items, in particular use the `application="apinizer"` filter; otherwise, the `sum()` function will aggregate worker and cache metrics together and the result will be misleading.
# Conclusion
Integrating Apinizer with Zabbix through Prometheus brings Apinizer-specific visibility into the operational monitoring platform that organizations already use. Metric collection is performed by Prometheus; Zabbix HTTP Agent items query those metrics and incorporate them into Zabbix's own history/trends/dashboard/trigger ecosystem.
This integration leverages the strengths of each component:
* Apinizer's comprehensive metric collection capability
* Prometheus's efficient time-series database and PromQL query language
* Zabbix's mature trigger, escalation, and notification routing capabilities
* The ability of the Zabbix Agent to combine OS-level host metrics with Apinizer metrics on the same dashboard
Set up the integration today to start monitoring your Apinizer environment end to end and centralize your operational data.
# Resources
For more information:
* Apinizer Documentation
* Prometheus Documentation
* Zabbix Documentation