> ## Documentation Index
> Fetch the complete documentation index at: https://docs.apinizer.com/llms.txt
> Use this file to discover all available pages before exploring further.
# Anomaly Detection on Failed Request Rate Increase: Examining Different Scenarios
> You can apply different scenarios for anomaly detection on failed request rate increase. You can perform anomaly detection by detecting increases in failed request count, increases in failed request rate, and using Bollinger bands.
**Scenario A**: In the *last 1 hour*, a ***50%*** increase in the ***failed request count*** to a specific API Proxy compared to the previous check will be considered an anomaly for us.
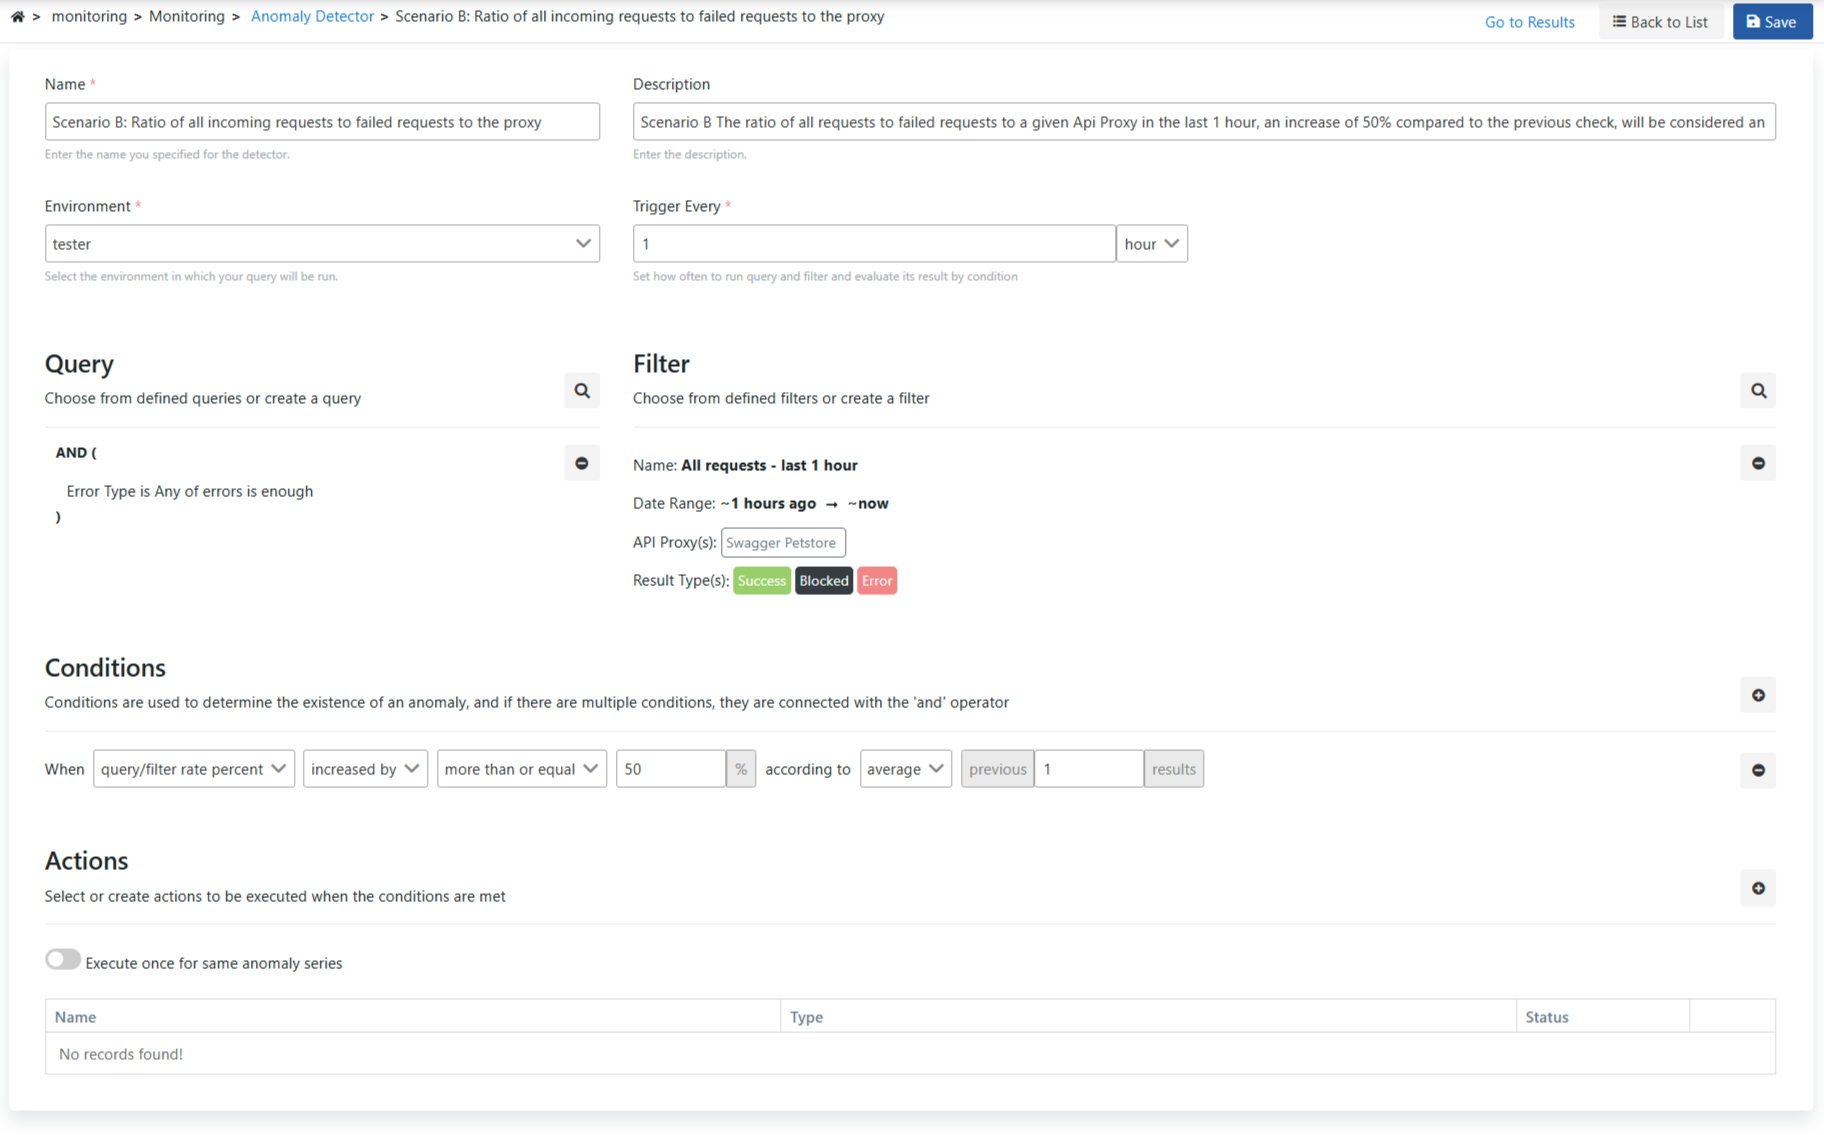
**Scenario B**: In the *last 1 hour*, a ***50%*** increase in the ***ratio of all requests to failed requests*** for a specific API Proxy compared to the previous check will be considered an anomaly for us.
**Scenario C**: Based on the last 10 data points, **blocked** requests are compared with Bollinger bands, and if they are **equal to or** higher than the **upper Bollinger** band, this situation is detected as an anomaly and notified.
If we think with example values, each scenario will check the situations specified below (Failed/Total ratio is given in parentheses);
**Scenario A**: If 100 requests came in the first check hour and 10 of them were errors (%10), the situation where 15 or more of the 100 requests coming in the next hour are errors (%15).
If 100 requests came in the first check hour and 10 of them were errors (%10), the situation where 15 or more of the 200 requests coming in the next hour are errors (%7.5). The point to note is that in this scenario, the error amount has increased, but the error rate has decreased compared to the total request count.
If 100 requests came in the first check hour and 10 of them were errors (%10), the situation where 2 or more of the 10 requests coming in the next hour are errors (%20). This situation is not considered an error in this scenario.
If 100 requests came in the first check hour and 10 of them were errors (%10), the situation where all of the 5 requests coming in the next hour are errors (%100). This situation is not considered an error in this scenario.
**Scenario B**: If 100 requests came in the first check hour and 10 of them were errors (%10), the situation where 15 or more of the 100 requests coming in the next hour are errors (%15).
If 100 requests came in the first check hour and 10 of them were errors (%10), the situation where 30 or more of the 200 requests coming in the next hour are errors (%15).
If 100 requests came in the first check hour and 10 of them were errors (%10), the situation where 2 or more of the 10 requests coming in the next hour are errors (%20). The point to note is that in this scenario, the error amount has decreased, but the error rate has increased compared to the total request count.
If 100 requests came in the first check hour and 10 of them were errors (%10), the situation where all of the 5 requests coming in the next hour are errors (%100). The point to note is that in this scenario, the error amount has decreased, but the error rate has increased compared to the total request count.
If 100 requests came in the first check hour and 10 of them were errors (%10), the situation where 20 or more of the 200 requests coming in the next hour are errors (%10). This situation is not considered an error in this scenario because the error amount has increased, but the error rate has not changed compared to the total request count.
**Scenario C**: The upper band of EMA can be used as a threshold that indicates a certain error rate is outside the normal range. In this case, if the error rate exceeds the upper band of EMA, it is marked as an anomaly.
## Scenario A
In this scenario, **only failed requests are filtered** and failed requests **within the last 1 hour** are examined. If the ratio of total failed requests coming in the previous hour is **50% or more**, this situation is considered an **anomaly**.
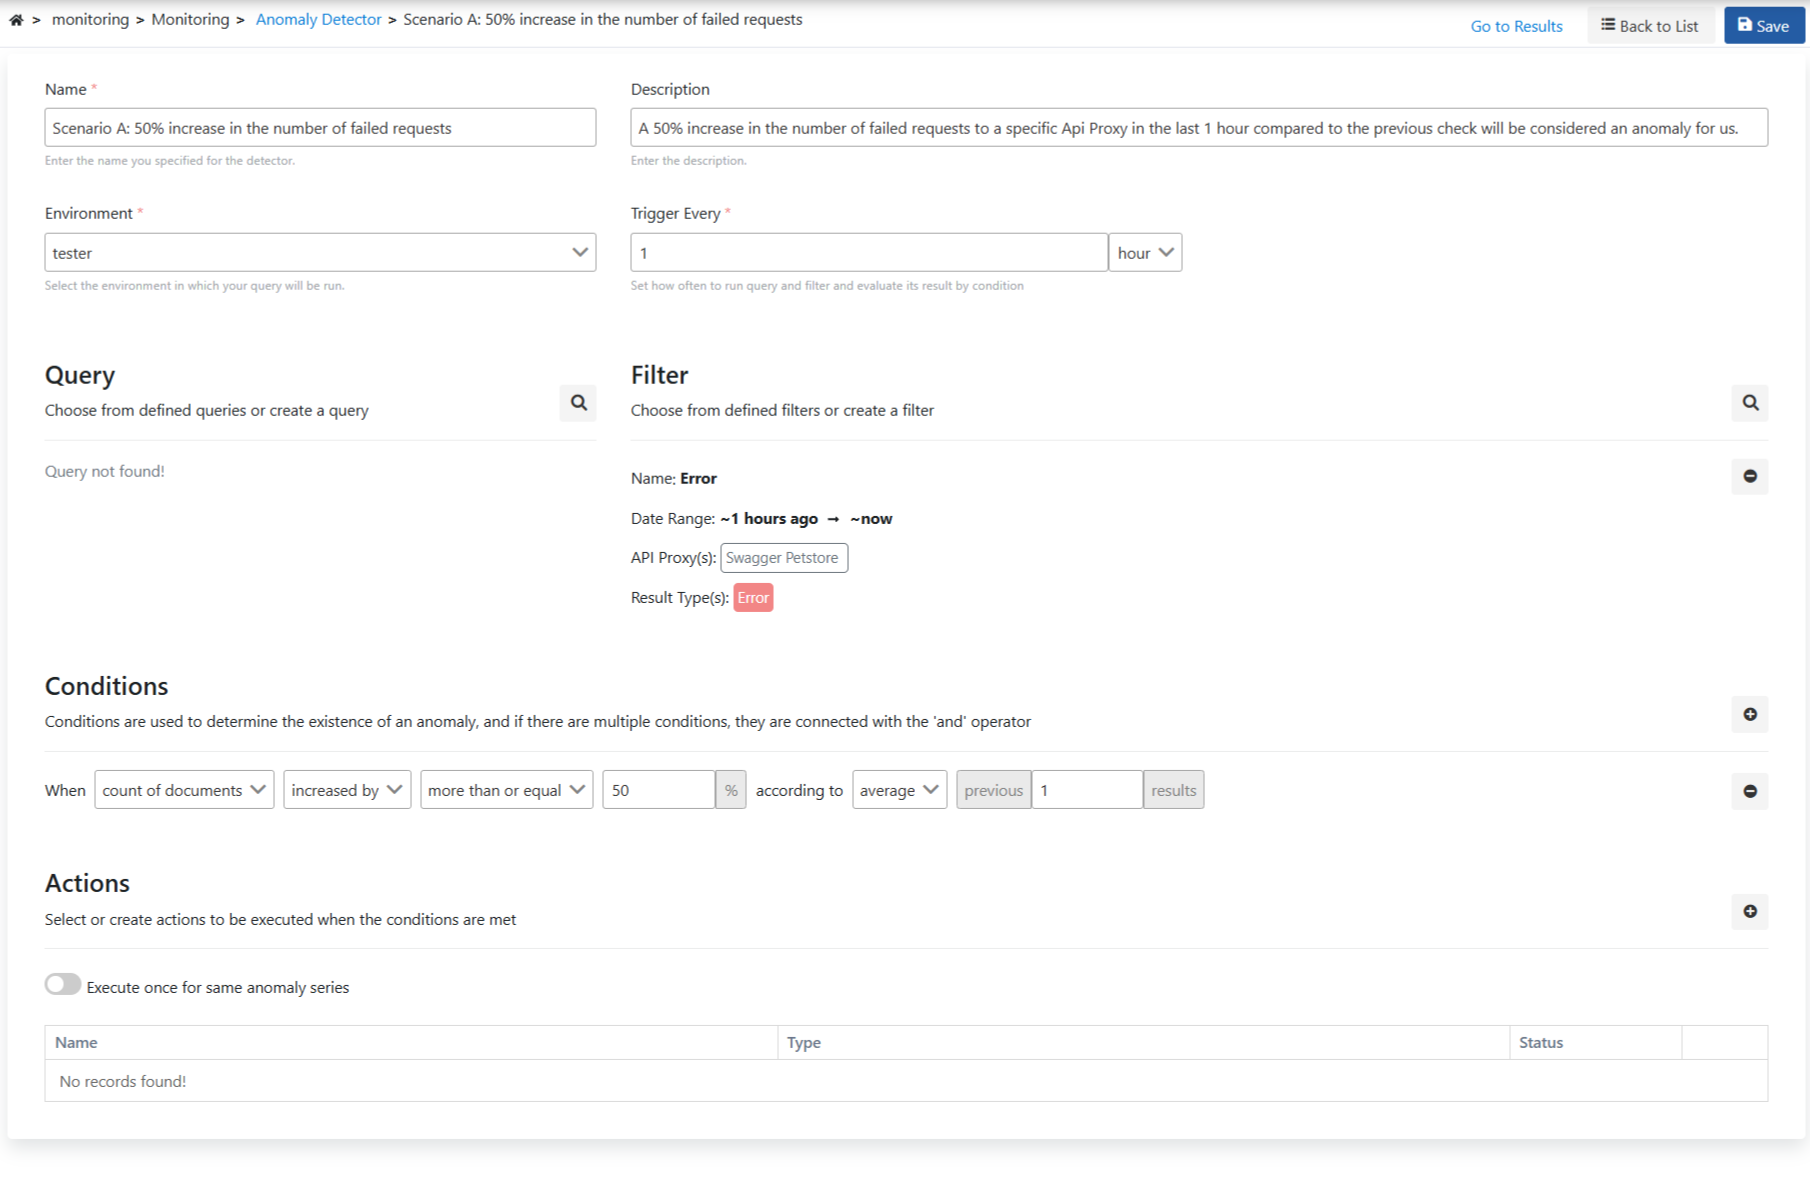 As shown in the following visual, what matters is not the request count, but the count of failed requests coming in the previous state. If 50% or more of this count comes as failed requests, an anomaly will occur.
 **Warning: Do not consider the hours in the visual, they are only added for example purposes.**
## Scenario B
**Purpose:** To measure the increase in error rate compared to the previous result as a percentage.
**Warning: Do not consider the hours in the visual, they are only added for example purposes.**
## Scenario B
**Purpose:** To measure the increase in error rate compared to the previous result as a percentage.
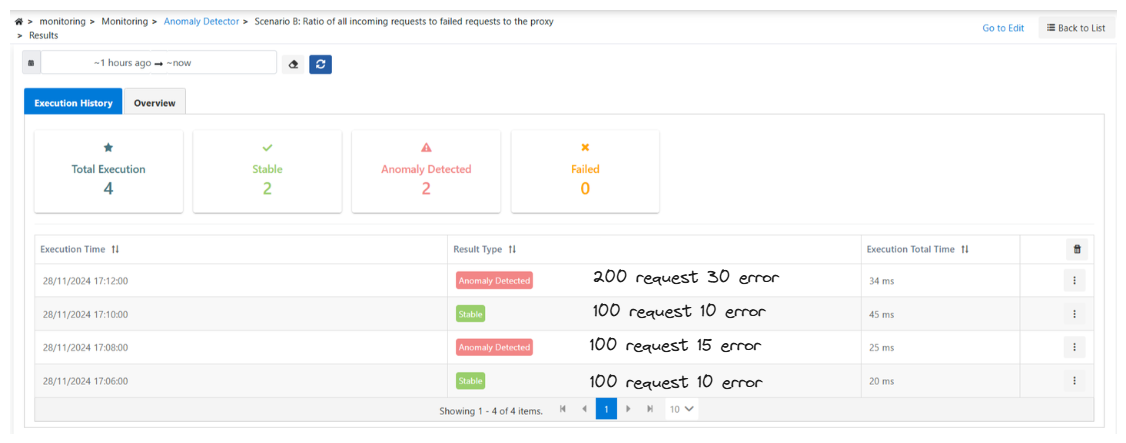 10 out of the first 100 requests are errors. Error rate = 10/100 = 0.10
15 out of the second 100 requests are errors. Error rate = 15/100 = 0.15
After calculating the ratio of all requests to failed requests, an anomaly occurs when a 50% increase occurs compared to the rate of the previous state.
**Warning: Do not consider the hours in the visual, they are only added for example purposes.**
## Scenario C
10 out of the first 100 requests are errors. Error rate = 10/100 = 0.10
15 out of the second 100 requests are errors. Error rate = 15/100 = 0.15
After calculating the ratio of all requests to failed requests, an anomaly occurs when a 50% increase occurs compared to the rate of the previous state.
**Warning: Do not consider the hours in the visual, they are only added for example purposes.**
## Scenario C
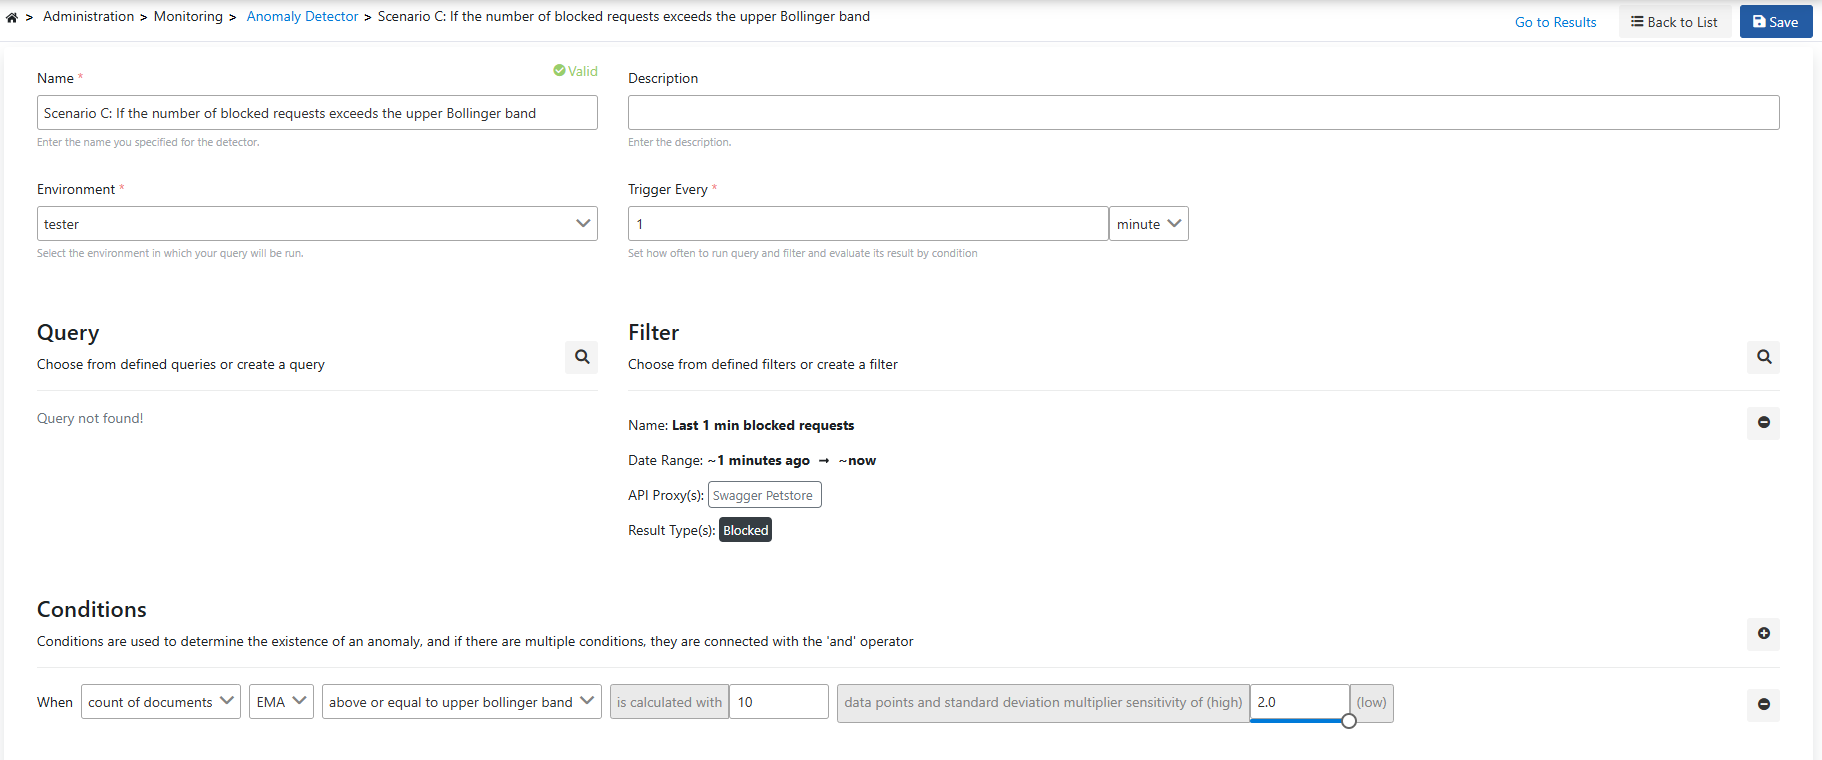
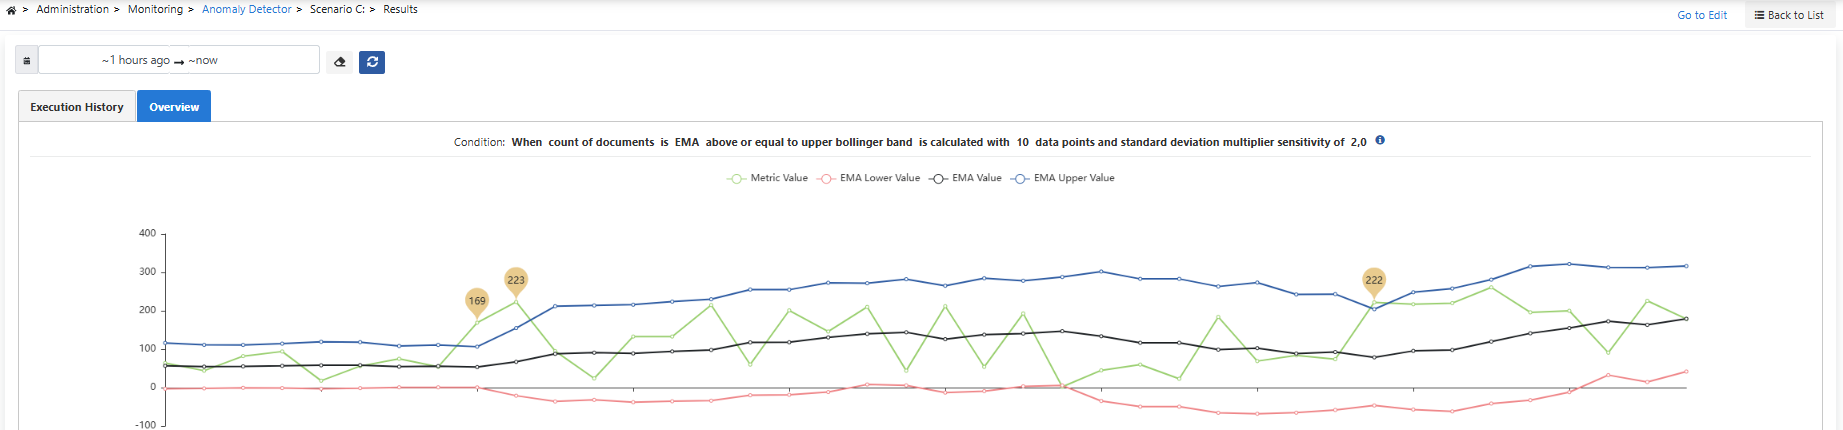 The count of blocked requests in the last 1 minute is compared with the EMA value calculated based on the last 10 data points, and if it is equal to or higher than the upper Bollinger band, this situation is detected as an anomaly, with the standard deviation multiplier sensitivity set to 2.0.
* **Green line (Metric Value)**: Shows the count of blocked requests.
* **Red line (EMA Lower Value)**: Represents the calculated lower Exponential Moving Average (EMA) value.
* **Black line (EMA Value)**: Shows the current value of EMA.
* **Blue line (EMA Upper Value)**: Represents the calculated upper EMA value.
According to the conditions, when the request count exceeds the upper Bollinger band (i.e., the blue line) within a certain time period, this situation is considered an anomaly.
The count of blocked requests in the last 1 minute is compared with the EMA value calculated based on the last 10 data points, and if it is equal to or higher than the upper Bollinger band, this situation is detected as an anomaly, with the standard deviation multiplier sensitivity set to 2.0.
* **Green line (Metric Value)**: Shows the count of blocked requests.
* **Red line (EMA Lower Value)**: Represents the calculated lower Exponential Moving Average (EMA) value.
* **Black line (EMA Value)**: Shows the current value of EMA.
* **Blue line (EMA Upper Value)**: Represents the calculated upper EMA value.
According to the conditions, when the request count exceeds the upper Bollinger band (i.e., the blue line) within a certain time period, this situation is considered an anomaly.