
Example Dashboards on Grafana for Apinizer Cache
For Grafana Setup and Prometheus Integration as a Data Source, you can refer to the related documentation.
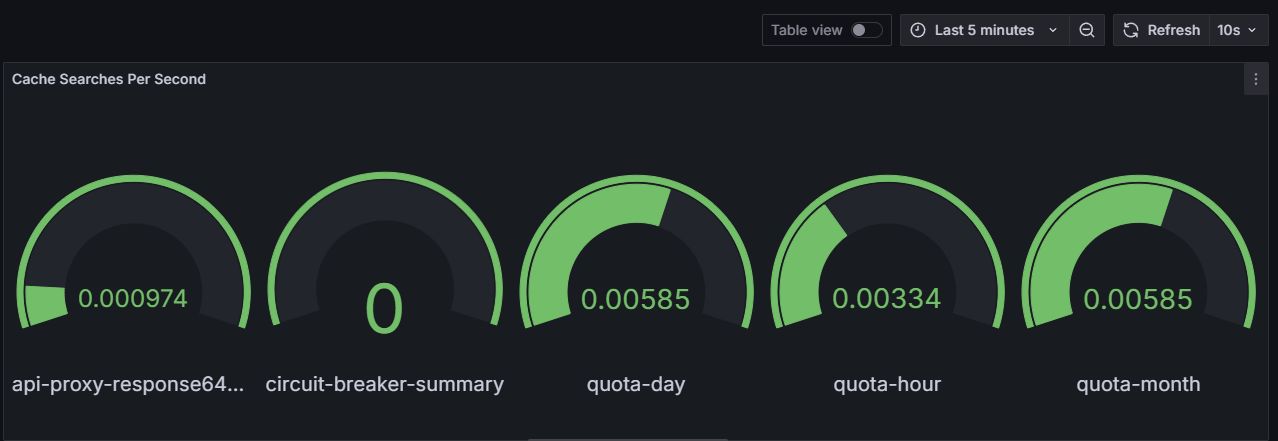
Panel 1: Cache Lookups Per Second
PromQL Query
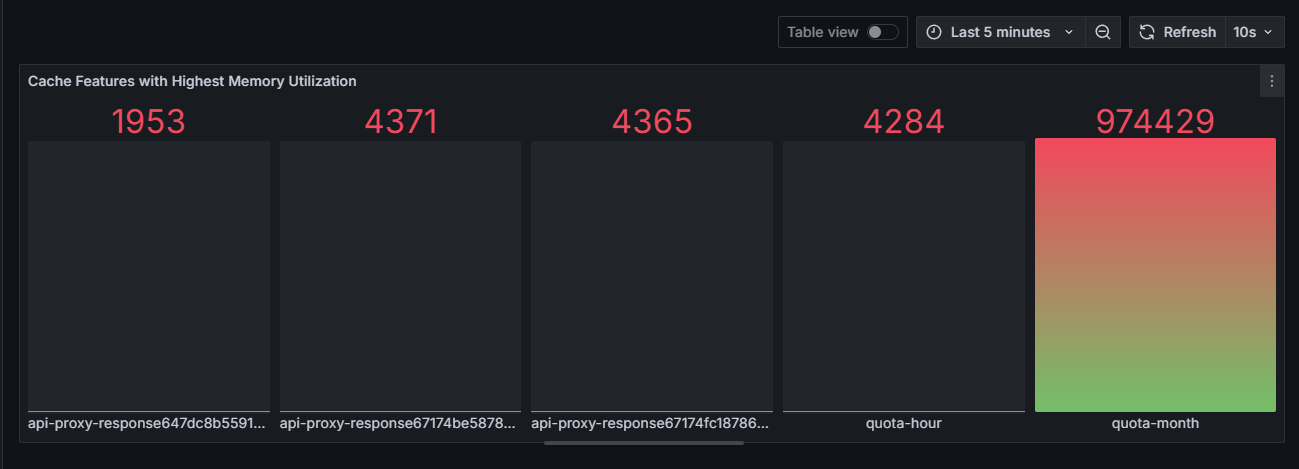
Panel 2: Cache Features with Highest Memory Usage
PromQL Query
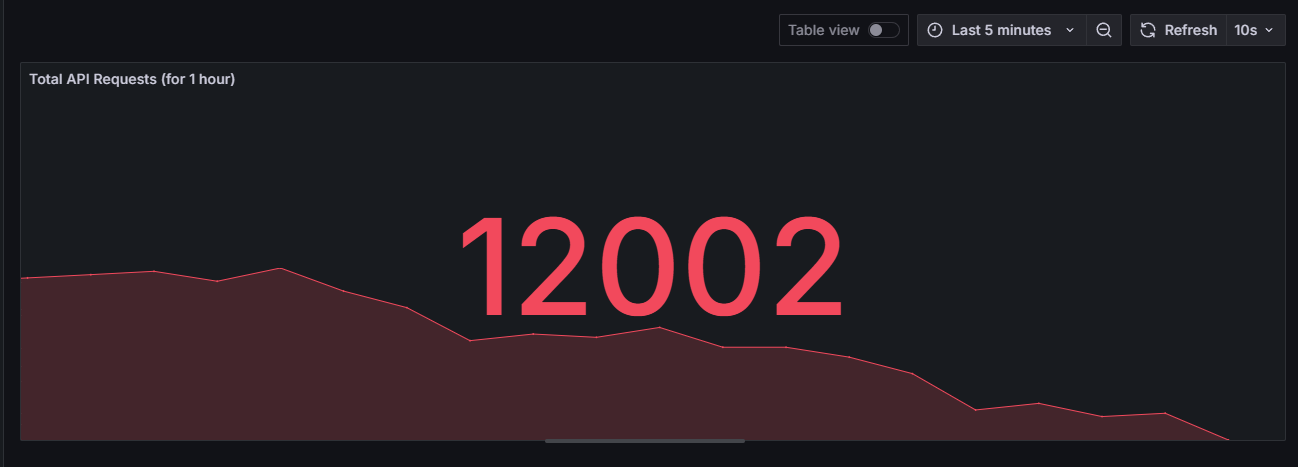
Panel 3: Total API Requests (for 1 hour)
PromQL Query