

Prometheus is a monitoring system that pulls metrics from specific targets and stores them as time series data. Scraping is the process by which Prometheus periodically collects metrics from target services. Apinizer Gateway metrics are provided on port 9091, and Prometheus can pull these metrics using two different methods.
Constant Scraping
Collecting metrics from services defined under static_configs with static IP addresses or DNS names
Dynamic Scraping
Automatically discovering pods through Kubernetes service discovery mechanism and collecting metrics
Prometheus Setup and Scraping Configuration
Static (Constant) Scraping Configuration
In the static scraping method, services to be monitored are defined under static_configs with predetermined static IP addresses or DNS names. Prometheus queries these services at regular intervals. This method is useful when service addresses do not change or can be manually defined.
METRICS_ENABLED=TRUE parameter must be defined as an environment variable for the relevant container.
Dynamic Scraping Configuration
The dynamic scraping method enables Prometheus to automatically discover pods within Kubernetes. With this method, there is no need to make manual scraping configuration for each new pod. Prometheus automatically pulls metrics using specific annotations added to pods. This method provides great advantages in microservice architectures and constantly changing infrastructures.
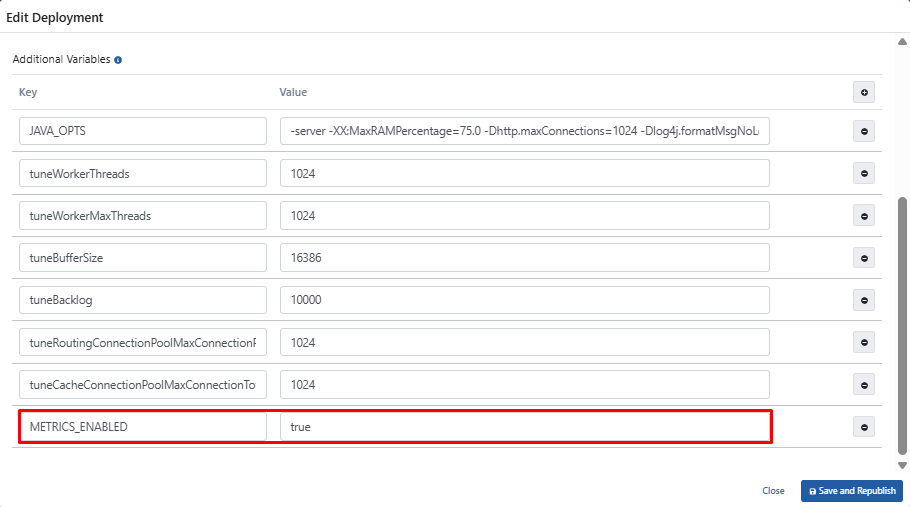
METRICS_ENABLED=TRUE variable must be added by selecting Worker edit deployment option in the Deployments & Services section on the Gateway Environments page.
If Kubernetes Management Is Not Done with Apinizer
For Prometheus to collect metrics from Worker pods, the relevant annotations must be added to the spec.template.metadata.annotations section of the relevant Deployment manifest. Additionally, for Apinizer Gateway to publish metrics on port 9091, theMETRICS_ENABLED=TRUE parameter must be defined as an environment variable for the relevant container. This way, the metrics service will be exported on port 9091, and Prometheus will automatically discover and scrape metrics from the Apinizer Gateway pod running on port 9091.
Prometheus Scraping Configuration
To discover annotations on pods, dynamic scraping must be enabled in Prometheus’s ConfigMap configuration using kubernetes_sd_configs.The following ConfigMap example enables Prometheus to dynamically discover Kubernetes pods. This configuration enables Prometheus to automatically discover Kubernetes pods and collect metrics only from pods with the
prometheus.io/scrape: "true" annotation. Thus, metrics can be collected by Prometheus by applying dynamic scraping to Apinizer Gateway without the need for manual target definition.Prometheus Installation
Persistent Storage Configuration
Since Prometheus metrics will be stored on a node in the Kubernetes cluster, PersistentVolume (PV) and PersistentVolumeClaim (PVC) definitions must be made. This configuration ensures that Prometheus preserves its data in shutdown or restart situations.
ServiceAccount and RBAC Configuration
Prometheus must have the necessary permissions to discover pods and collect their metrics. For this, the following ServiceAccount, ClusterRole, and ClusterRoleBinding definitions must be made.
When Prometheus is deployed on Kubernetes, it creates a Kubernetes service named prometheus-service of type NodePort. This service is necessary for accessing Prometheus from outside Kubernetes. However, you can adapt this to use Ingress or whatever connection method your organization uses instead of this service.