

1-) Grafana Installation

Persistent Storage Configuration

Since Grafana’s data will be stored on a node in the Kubernetes cluster, PersistentVolume (PV) and PersistentVolumeClaim (PVC) definitions must be made. This configuration ensures that Grafana preserves its data in case of shutdown or restart.
The PersistentVolume (PV) and PersistentVolumeClaim (PVC) configuration above ensures that Grafana stores its data on a specific node. However, the hostPath used here is dependent on the local file system of the specific node where Grafana runs.Therefore:
  • If Grafana pods are moved to a different node, they will lose their data unless the same hostPath directory exists on the new node.
  • To guarantee that pods always run on the same node, pods must be pinned to specific nodes using nodeAffinity or nodeSelector.
Alternatively, NFS, Ceph, Longhorn or a cloud-based storage solution can be used to store data in a node-independent manner.

Grafana Secret Configuration

The username and password to be used in the Grafana interface are stored with the secret given below.

Grafana Deployment Configuration

Load the Grafana Deployment YAML file below into your Kubernetes Cluster by modifying it to suit your systems.

Kubernetes Service for Grafana is created.

When Grafana is deployed on Kubernetes, it creates a Kubernetes service named grafana and of type NodePort. This service is necessary for accessing Grafana from outside Kubernetes. However, you can adapt this service according to the structure you use for Ingress or connection method in your organization.

2) Setting Prometheus as Data Source on Grafana

  1. Log in to Grafana
  2. Click the Data Source tab from the left menu and select Add new data source option.

Data Source Seçimi
  1. Prometheus is selected as the data source. 4. Prometheus Connection url and other necessary settings are entered and saved.
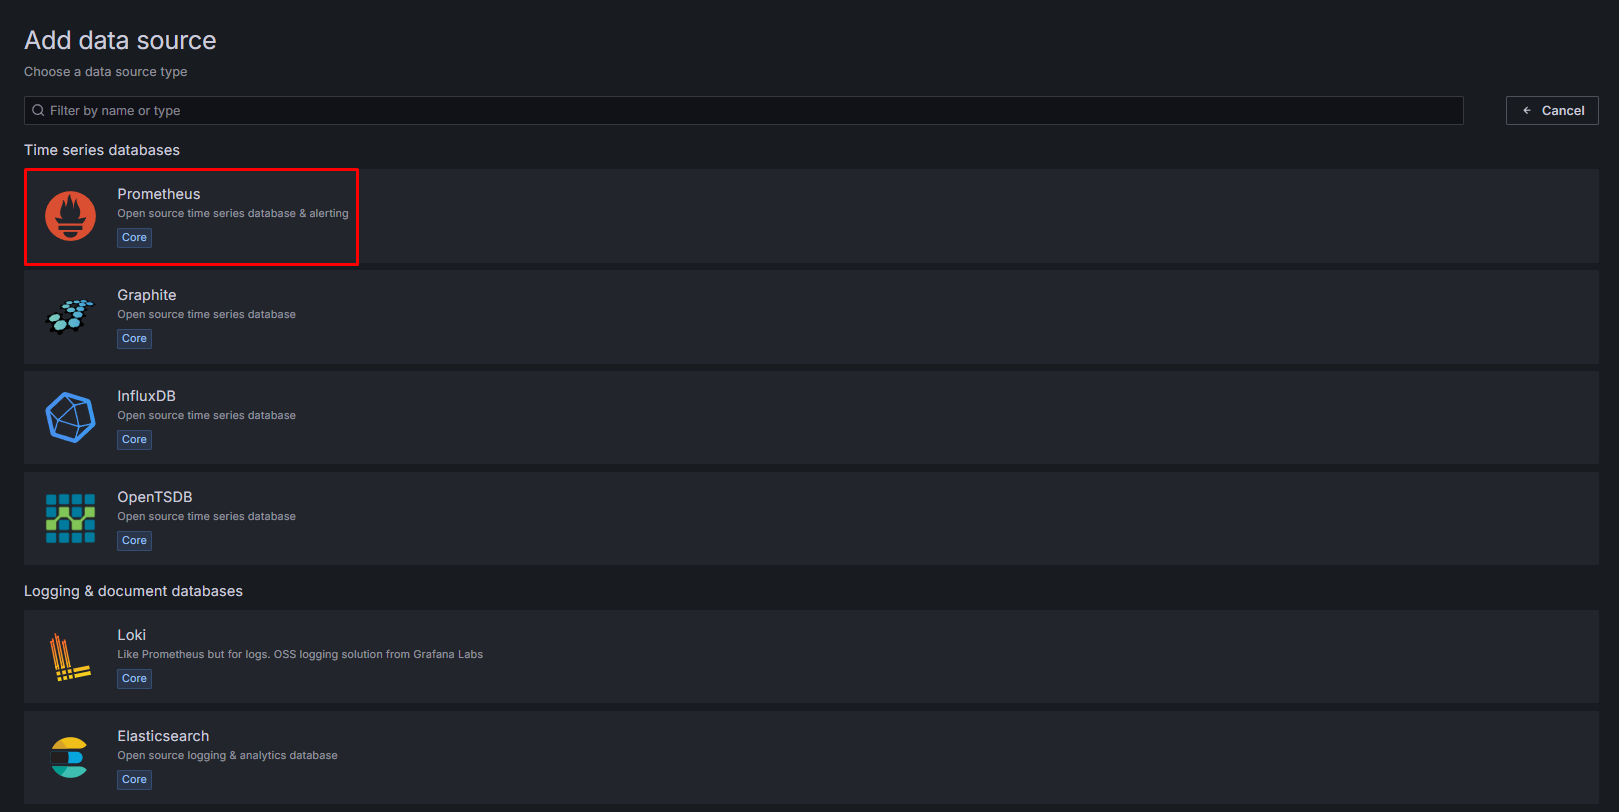
Data Source Olarak Prometheus Seçimi
  1. The Prometheus Connection URL and other necessary settings are entered and saved.
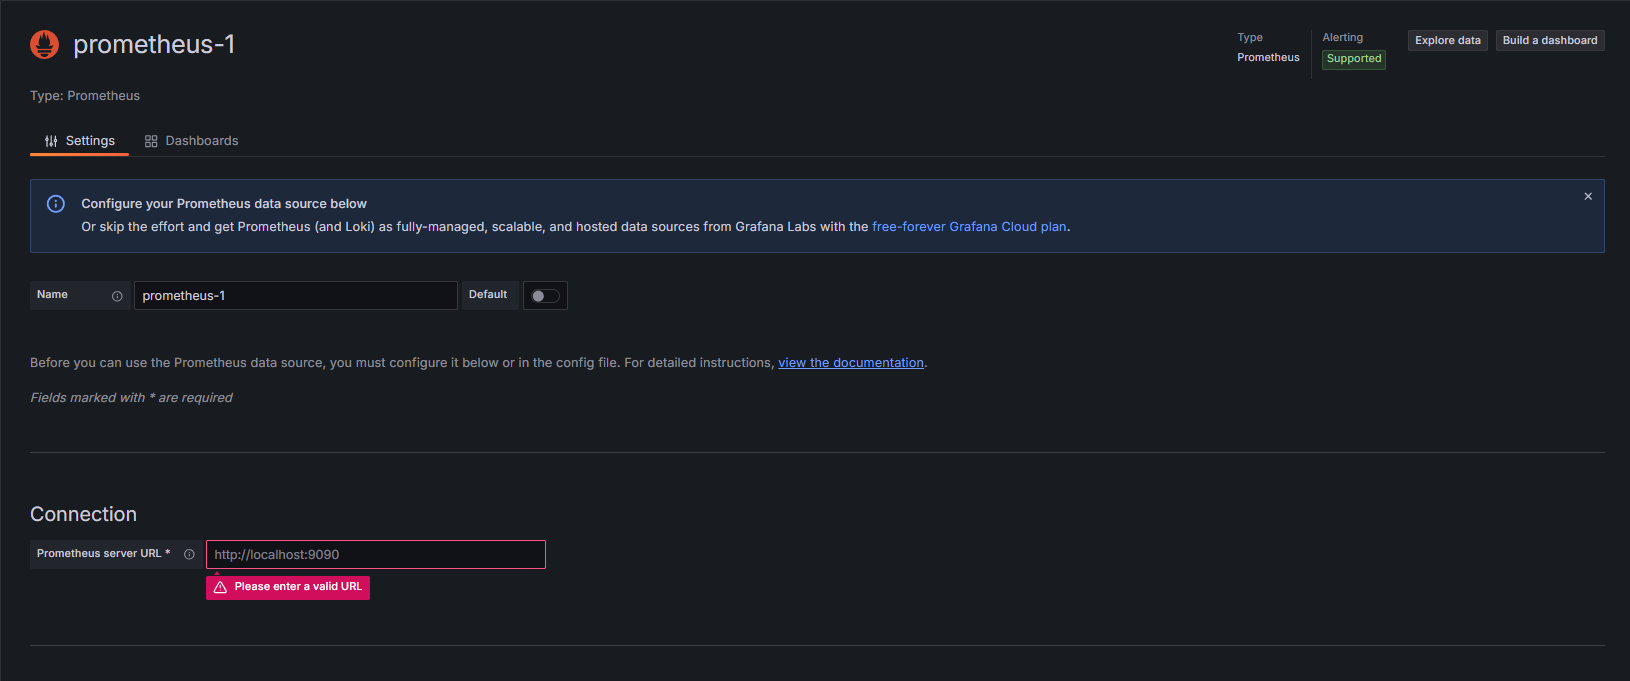
Prometheus Connection URL Ayarlanması
  1. Click the Dashboard tab from the left menu and select the new dashboard option.

New Dashboard Oluşturma
  1. A new dashboard is created and prometheus is selected as the data source.
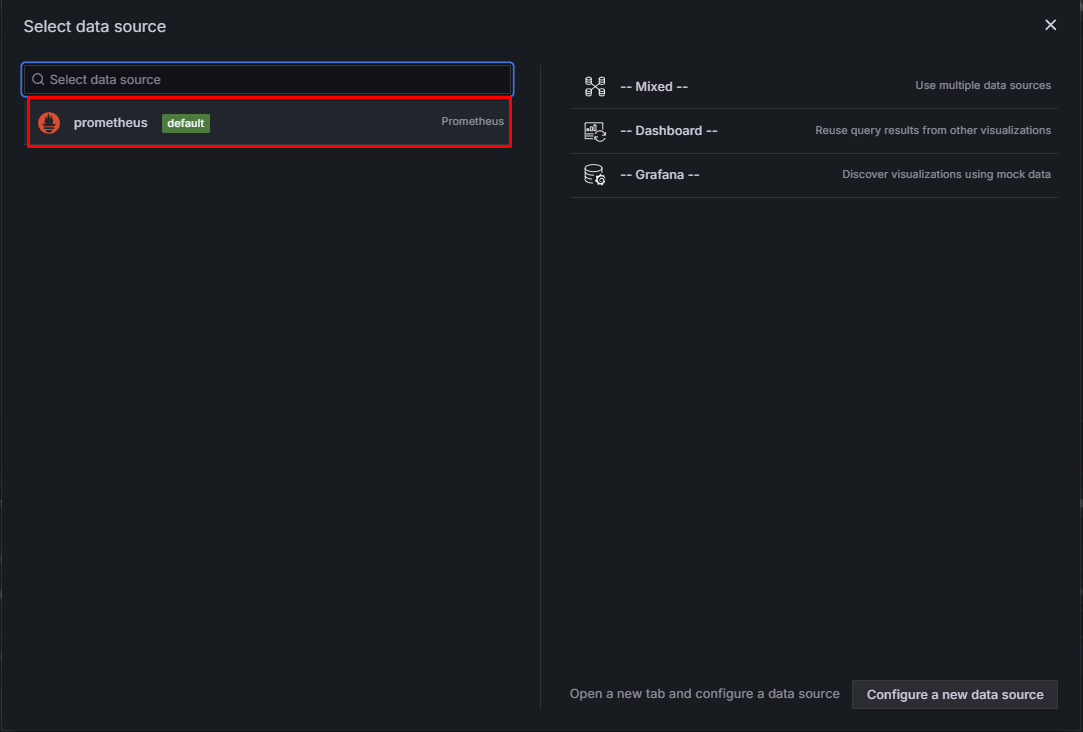
Data Source Seçimi