Report Types
When creating a Report Generator, you first select which dataset the report will be based on. The available fields in subsequent steps vary depending on the selected type.Report Creation
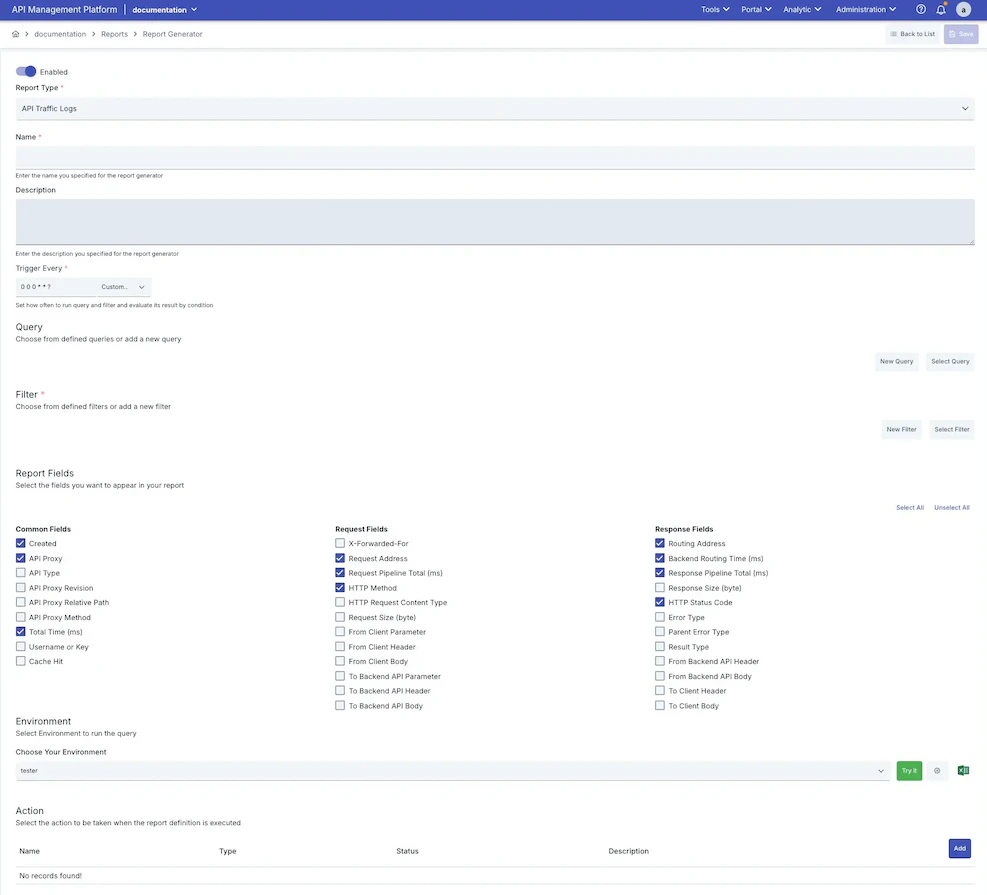
Definition
Query
This step is only visible for the API Traffic Logs report type.
- New Query — A new query can be created on the fly.
- Select Query — An existing previously defined query can be selected.
Filter
The filter determines which log records will be evaluated in the report. This step is required. Two options are available:- New Filter — A new filter can be created on the fly.
- Select Filter — An existing previously defined filter can be selected.
Report Fields
This step is only visible for the API Traffic Logs report type.
- Common Fields
- Request Fields
- Response Fields
Report Parameters
Additional parameters appear based on the selected report type. These parameters allow the scope of the report to be defined in more detail.Environment
The environment on which the report will run is selected in this step.For Elasticsearch-based report types, environment selection is required. The selected environment must have an active Elasticsearch integration.
Trigger Every
The frequency at which the report will run automatically is set in this section. Scheduling settings are created in cron expression format.Action
Where the file generated when the report runs will be sent is defined in this section. One or more recipients can be added. Supported action types include email and webhook. For detailed information about actions, see the Connectors page.Retention Period
How long result records from past report runs will be kept is set in this section. At the end of the specified period, old results are automatically cleaned up.Testing the Report
An option is provided to test the report instantly with current settings before saving.- API Traffic Logs
- Other Report Types
After the query and filter are defined, the query is run instantly on the selected environment using the Query button. Results are listed in a paginated table view on screen.Results can be exported as Excel, allowing the instant query output to be examined in more detail.
Only the first 10 records are shown in the preview. To see all results, you need to schedule and run the report.
Report Results
Past run results of a saved Report Generator can be viewed from the detail screen opened by clicking the relevant record in the list. The Edit Report Generator link in the top right of the screen navigates to the definition edit page.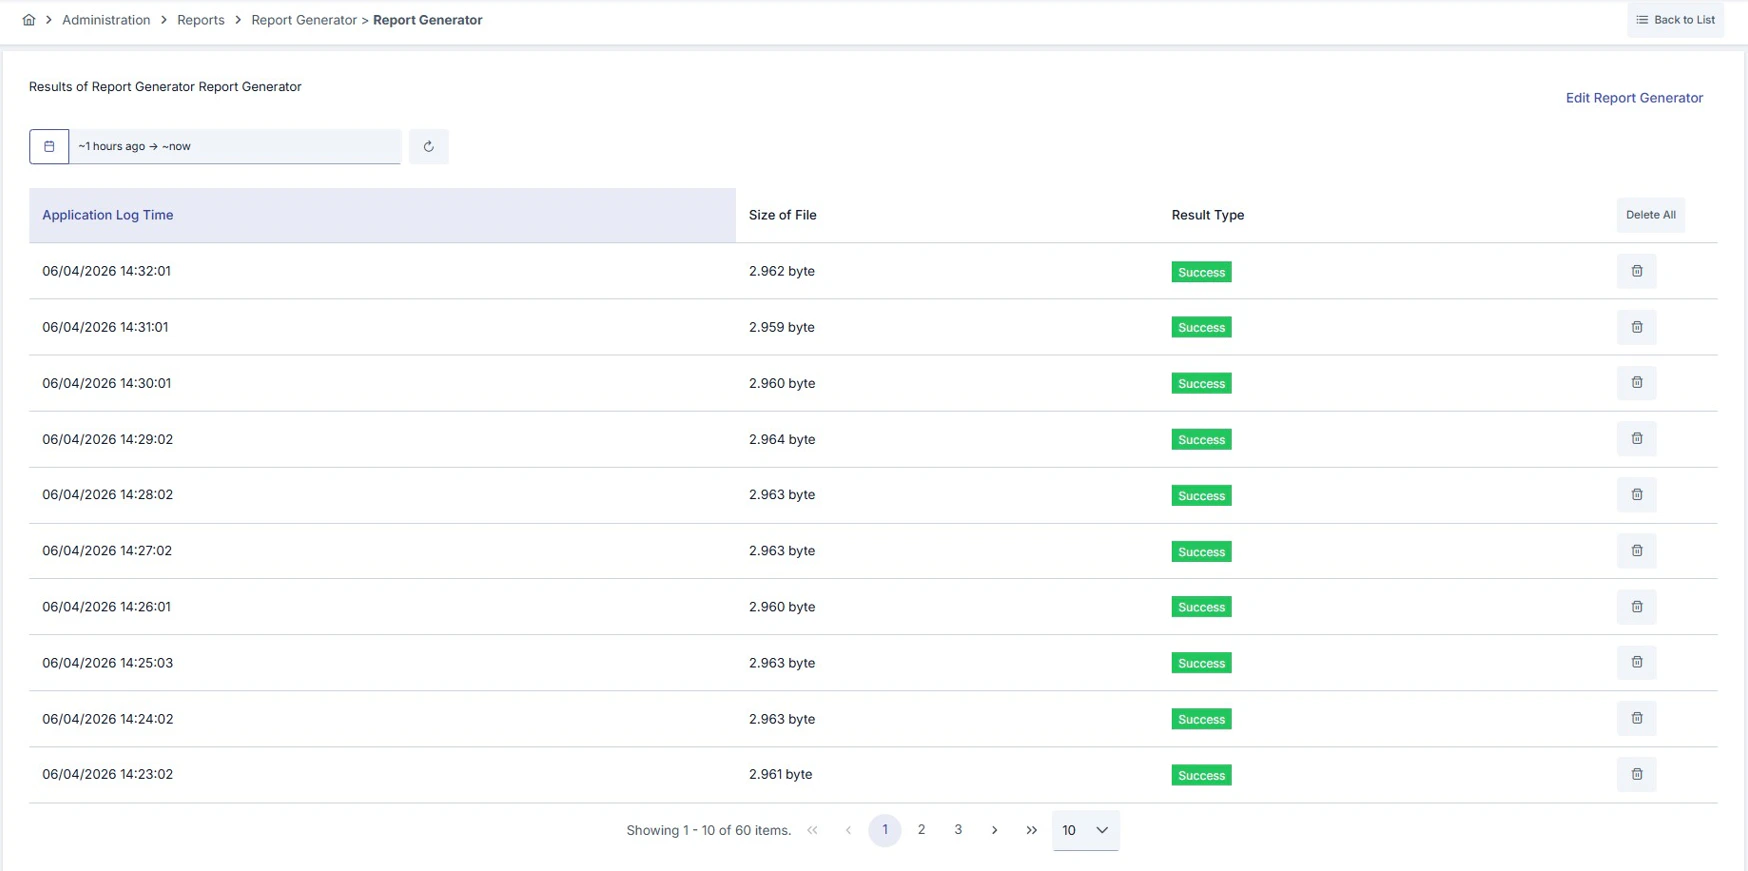
Date Range Filter
Results can be filtered using the date range picker at the top of the screen. Relative time ranges (e.g. “Last 1 hour”) or fixed date ranges can be defined.Result Management
- A single result record can be deleted using the delete icon on the right side of each row.
- All past results for that Report Generator can be cleared at once using the Delete All button in the table header.