

PROMETHEUS
Prometheus is an open-source system and network monitoring tool designed for Kubernetes and microservice architectures. It collects, stores, queries, and creates graphs of performance data.1) Prometheus Installation
The environment (namespace) to work in is created:http://<KUBERNETES_WORKER_IP_ADDRESS>:<NODE_PORT>.
2) KUBE-STATE-METRICS Installation
Kube-state-metrics is used to collect information about the status of resources (e.g., pods, services, replicasets) in the Kubernetes cluster.3) Grafana Installation
Grafana is an open-source data visualization web application. You can connect to various data sources and display your data in charts and graphs and interpret it more easily.Grafana installation on Ubuntu operating systems is described below. Deployment configuration can be used for Grafana installation on Kubernetes.
http://<SERVER_IP_ADDRESS>:3000.
Default login information for Grafana:
- username: admin
- password: admin
4) Adding Prometheus Connection in Grafana
A Prometheus connection information is added from the left menu. Prometheus is selected. By clicking the “Add new data source” option, the Prometheus server URL information is entered and the connection is saved.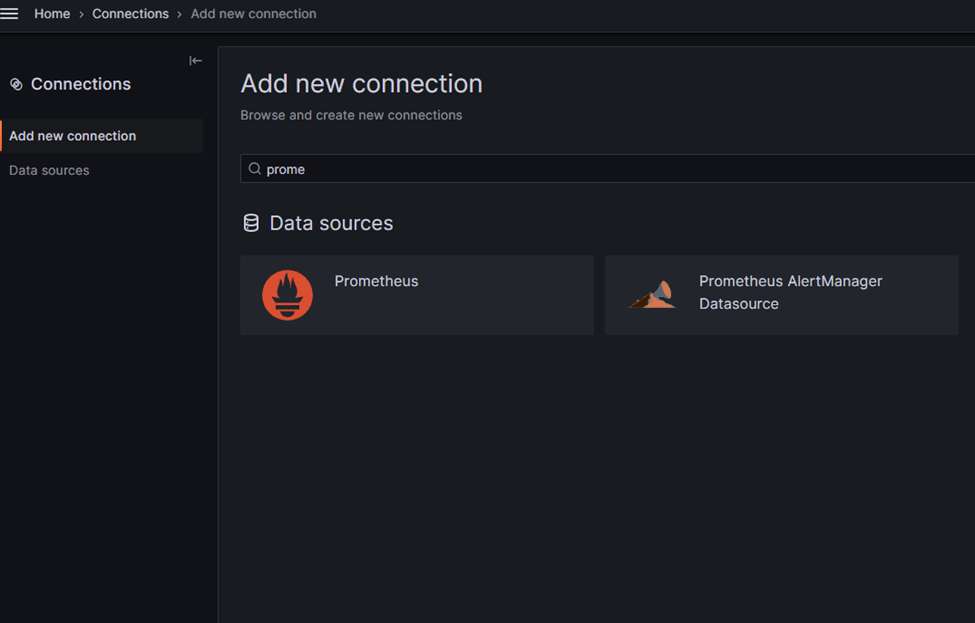
Grafana - Adding Prometheus data source
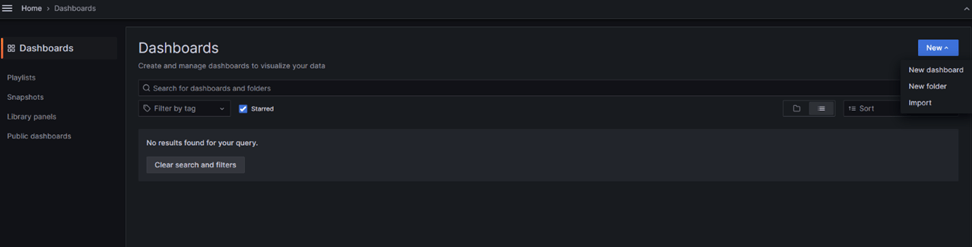
Grafana - Dashboard import screen
Dashboard ID: 315
Visually presents information such as CPU usage, memory usage, and network transaction intensity in your cluster and nodes.
Dashboard ID: 13498
Visually presents CPU usage, memory usage, and network transaction intensity information at namespace, pod, and container levels.