Regions Where Log Records Are Kept
API Proxy messages can be logged in the following regions:Request from Client
Request messages coming from client to API Proxy
Request to Target
Request messages transmitted from API Proxy to Backend API
Response from Target
Response messages given from Backend API to API Proxy
Response to Client
Response messages sent from API Proxy to client
Production Environment Recommendations
Since all policies’ settings and tests are completed in API Proxies running in production environment, no development will be done. To prevent data from growing excessively in the database, logging of the following regions can be disabled:- Request to Target: Requests transmitted from API Proxy to Backend API
- Response from Target: Responses given from Backend API to API Proxy
Logging on Failure or Block
Logging Disabled Fields on Failure: Even when specific log fields are turned off, you may still want them recorded when a request is blocked by a policy or fails with an error, so that the cause can be analyzed. This behavior is now controlled per connector via the “Enable logging disabled fields on Block” and “Enable logging disabled fields on Failure” toggles, configured when the connector is added to the environment. See.
Formdata Requests
WebSocket and gRPC Requests
WebSocket and gRPC: Since WebSocket and gRPC requests are kept as data coming to Apinizer and data going out from Apinizer, only 2 regions exist in these types of API Proxies:
- Request from Client / Response to Client
- Request to Target / Response from Target
Log Settings Tab
The Log Settings tab on the API Proxy detail page is a dedicated tab for managing traffic log configuration. The log settings section that was previously at the bottom of the Settings tab is now managed from this separate tab.Three-Level Configuration: You can configure log settings at three levels:
- API Proxy level: General log settings for each API Proxy
- Environment level: Log settings specific to the selected environment (settings are stored per environment)
- Method level: Custom log settings for specific API methods (Method Overrides)
Log Settings Screen
Log settings can be configured in the Log Settings tab on an API Proxy basis and per environment. If integration settings have been made, which API Proxies’ traffic records will be sent to these integration targets can also be configured. These settings apply not only to Elasticsearch but also to all connector types such as Kafka, RabbitMQ, Database, ActiveMQ, Syslog, Webhook, Logback, Graylog. The connector list is dynamically generated based on the connector instances defined in the environment; multiple connectors of the same type can be configured and each is managed independently.When a database connector is selected as a log target, the schema prefix and custom table names for log tables are configured in the Connection definition. See Database Connection for details.
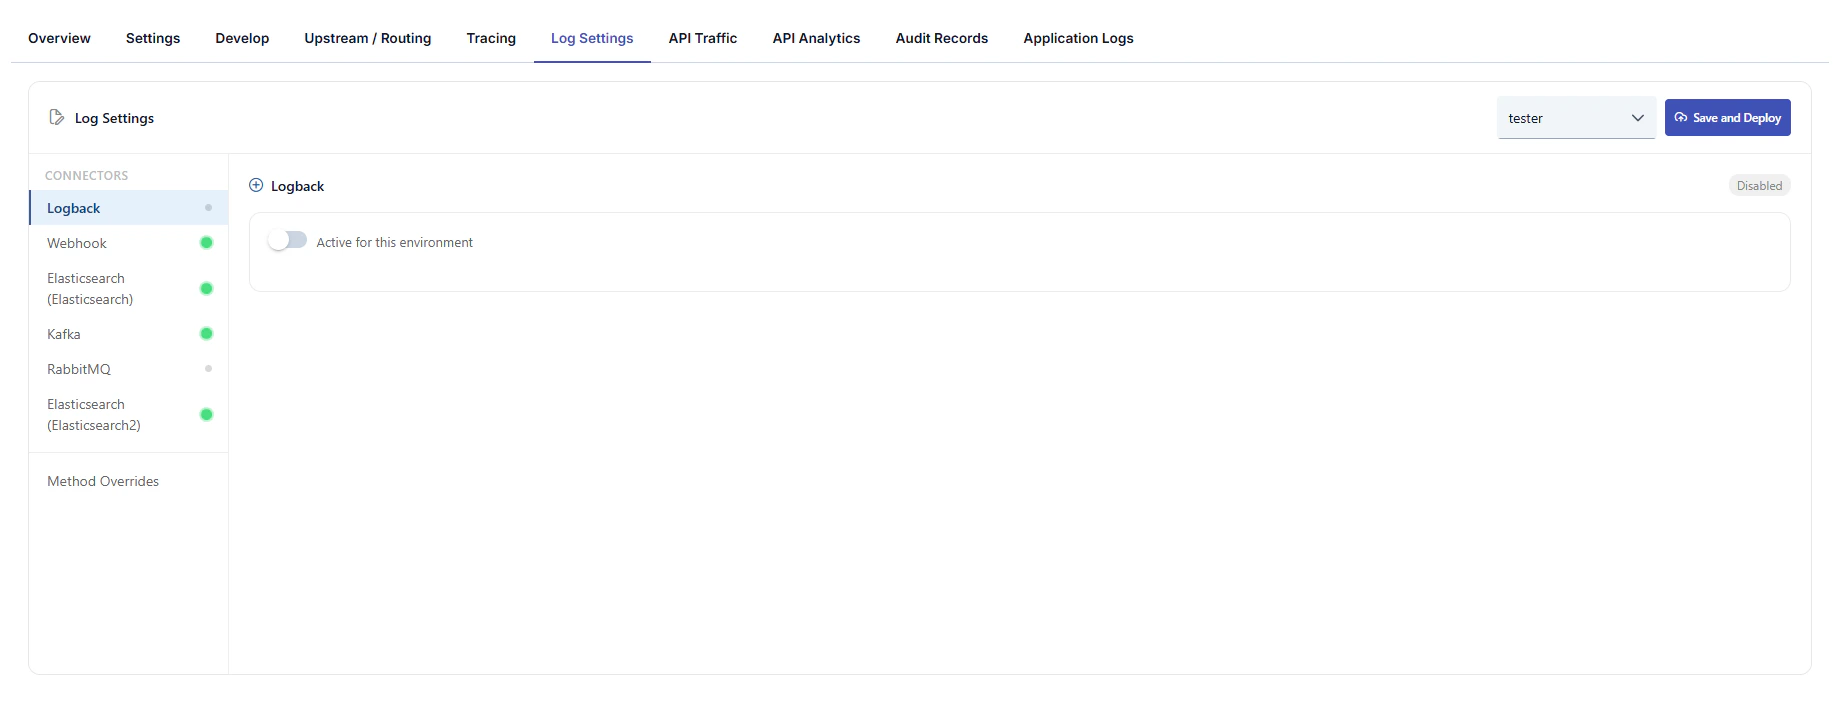
Screen layout
API Proxy top navigation: Overview, Settings, Design, Develop, Upstream / Routing, Tracing, Log Settings (active tab), API Traffic, API Analytics, Audit Records, Application Logs, and related items. Top bar:- Environment: Select the environment to which log settings apply; settings are stored per environment.
- Save and Deploy: Saves changes and triggers deployment to the selected environment.
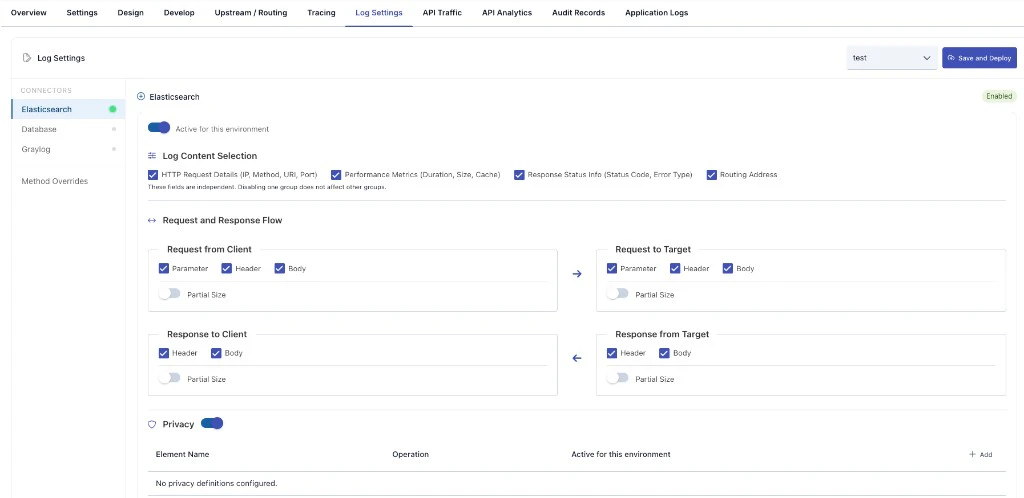
- Connectors defined in the selected environment are listed (the example screenshot shows Elasticsearch, Database, and Graylog). The list is dynamic and reflects actual connector records in the environment.
- When multiple connectors of the same type exist, each may be shown with a distinguishing name; with a single instance, only the type name may appear.
- Method Overrides: Define log rules that differ from defaults for specific API methods; the number of overrides is shown as a badge.
- Enabled status (e.g. green badge) and Active for this environment toggle to turn log delivery on or off for this environment.
-
Log Content Selection — independent groups (disabling one does not affect the others):
- HTTP Request Details — IP, method, URI, port, etc.
- Performance Metrics — duration, size, cache, etc.
- Response Status Info — status code, error type, etc.
- Routing Address
- Request and response flow: Across the four message regions, Parameter, Header, and Body logging can be toggled separately; request-side regions typically offer all three, response-side regions typically Header and Body. Each region may include Partial Size to control partial (size-limited) recording for body/header.
-
Privacy: When enabled, a table defines masking or similar rules by element name and operation; use + Add for environment-specific privacy definitions. If none exist, an empty-state message is shown.
Log settings previously lived under the Settings tab; they are now on the Log Settings tab. For platform-wide defaults, see General Settings.
Connector Settings
The following fields can be configured independently for each connector instance:Method Overrides
You can define different log settings for specific API methods than the default connector settings. For example, you can disable body logging for a sensitive method while keeping it enabled for others.- Add Method Override: Define custom settings by selecting a method and connector.
- Header, parameter, and body logging can be configured separately for each override.
- Existing overrides can be edited or deleted.
Previously configured log settings are automatically preserved. Existing settings seamlessly transition to the new connector-based system with no additional action required.
Privacy Settings
Privacy settings can be made to protect sensitive data in API Proxy traffic logs. These settings are configured when connectors are added to the environment. Which fields will be logged and which fields privacy operations (masking, deletion, hashing, encryption) will be applied to can be determined. For detailed information, you can refer to the Adding Connectors to Gateway Environments page.In the Log Settings section, log settings are managed on an API Proxy basis.
Related Pages
Next Steps
General Settings
API Proxy general settings
General Information Tab
API Proxy general information