

Overview
Purpose
- The Log policy captures a snapshot of the current message state at any point in the message processing pipeline and sends it to the configured connectors.
- Unlike standard traffic logging, it can be placed at intermediate points in the pipeline (for example, before and after a transformation policy) to observe message changes.
- It works with HTTP, WebSocket, and gRPC protocols.
- It can send data to multiple connectors simultaneously.
How It Works
- Policy Trigger: Runs when the log policy’s turn comes in the message processing pipeline.
- Snapshot Creation: The current message state is captured per protocol (headers, parameters, body information).
- Send to Connectors: The snapshot is sent to each defined connector individually.
- Privacy Application: If privacy settings are enabled, sensitive data is processed before delivery (mask, delete, hash, encrypt).
Use Cases
- Monitor message state at specific pipeline stages (before/after policy comparison)
- Collect detailed logs for debugging and troubleshooting
- Meet audit and compliance requirements
- Send real-time data to external systems (SIEM, log analysis platforms)
Supported Targets
Protocol Support
In the WebSocket and gRPC protocols, header and parameter information may be limited due to the nature of the protocol.
Configuration Fields
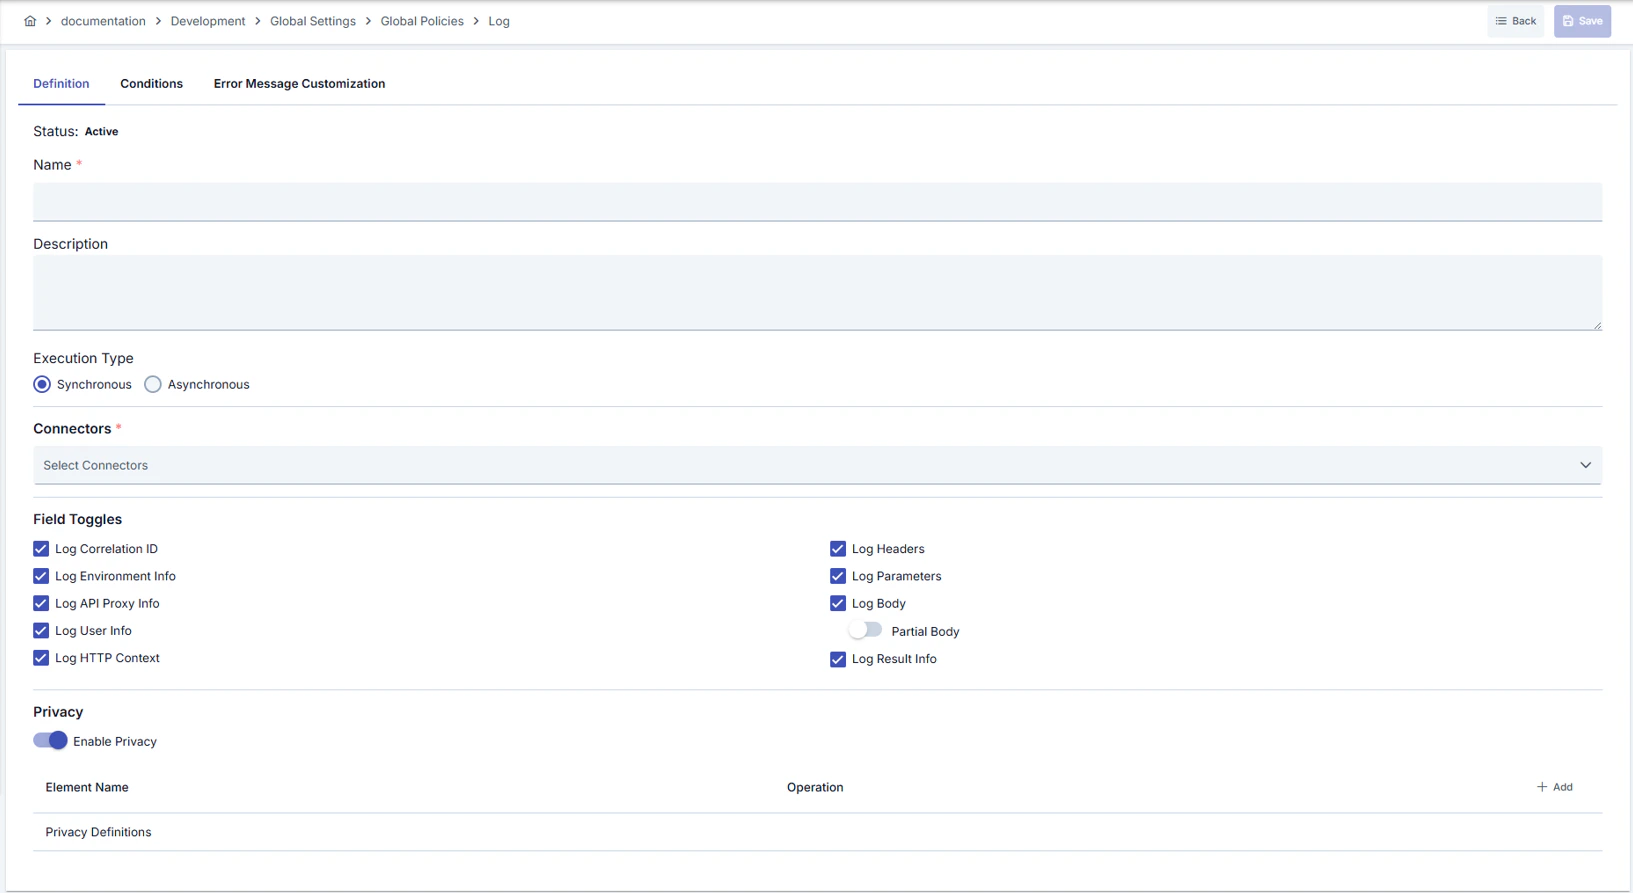
General Settings
Connector Selection
You can select the connectors the policy will send logs to. Connectors are selected through their connection definition and work environment-independent — the same connection definition may correspond to different connector instances across environments.
Definitions marked as global policies can be used in multiple environments; the connector corresponding to the same connection definition must be configured in each environment.
Logged Fields
You can choose which of the following field groups are included in the log record:Body Logging Mode
Execution Modes
Data Structure
The Log policy uses a lightweight data structure that is different from standard API traffic logs. The following table lists the fields sent and their Elasticsearch/database equivalents.Example JSON Output
Each entry in the header and parameter fields consists of k (key) and v (value) pairs. This structure is indexed as
nested type in Elasticsearch.Pipeline Position (cr) Values
Attachment Scope (cl) Values
Elasticsearch Integration
A separate index template must be created for log policy data in Elasticsearch. This template is different from the standard API traffic log template and contains only the fields sent by the log policy.Step 1: Create ILM Policy
Create an ILM policy for index lifecycle management. The following example creates a policy that rolls over at 30 GB or 1 day and deletes after 30 days. Adjust the values according to your needs.Step 2: Create Index Template
Run the following command using Elasticsearch Kibana Dev Tools or curl. The template includes data stream support.Step 3: Create Data Stream
After the template is created, the data stream is automatically created when the first data arrives. To create manually:Connector Configuration
Enterapinizer-log-policy-capture in the Elasticsearch connector’s Index Name field. This name must match the index_patterns in the template.
If you want to use a different index name, update the
index_patterns field in the template accordingly. For example, for project-based separation you can use apinizer-log-policy-capture-projectname.Database Integration
The Database connector writes each log policy capture as a single row into thelog_PolicyCapture table on the target relational database. Supported database types are Oracle, MySQL/MariaDB, PostgreSQL, and SQL Server. For MongoDB, the collection is created automatically on first write — no manual setup is required.
The
correlation_id column links request and response rows of the same call. When the log policy is placed at multiple pipeline stages (for example, FROM_CLIENT and TO_CLIENT), records can be joined on correlation_id to trace a transaction end to end. The index on this column is therefore strongly recommended.Privacy Settings

Privacy settings are applied at two levels: first the policy-level settings, then the connector-level settings. If both levels are enabled, each is applied in sequence.
Usage Scenarios
Related Pages
- Message Flow and Policy Management
- API Proxy Traffic Log Settings
- Connectors
- Adding Connectors to Gateway Environments
Deleting the Policy
For the steps to delete this policy and the actions to be taken when it is in use, see the What is a Policy? page.Exporting/Importing the Policy
For the export steps and available options for this policy, see the What is a Policy? page.Attaching the Policy to an API
For the process of attaching this policy to APIs, see the Adding Policy to Flow section on the Policy Management page.Next Steps
Script Policy
Transform data with custom scripts
API Call Policy
Make external API calls inside the pipeline